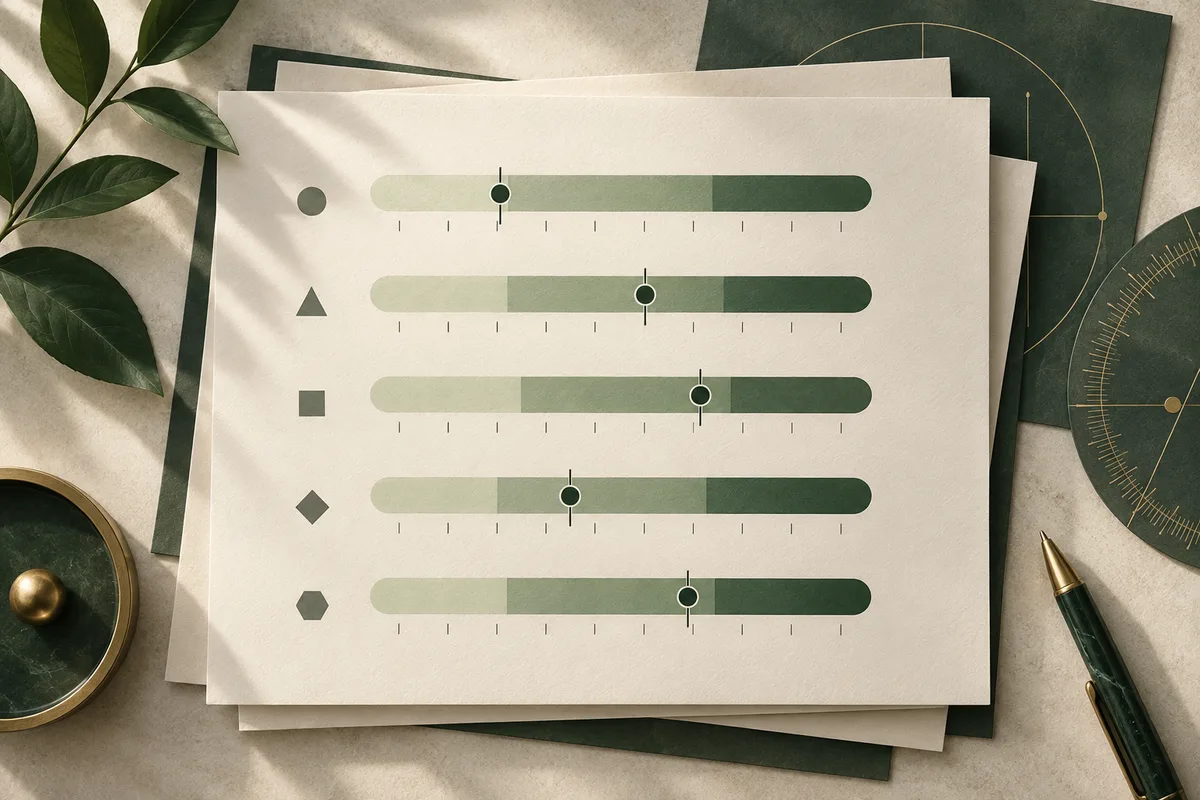
A personality report uses low, average, and high bands to turn a continuous score into a short description of its position relative to a defined comparison group. The labels make a report easier to read, but they do not mean good, bad, healthy, unhealthy, or permanently fixed. Their meaning depends on the instrument, the norm group, the rule used to set the boundaries, and the intended use of the report. A careful reader checks what was measured, how the score was transformed, how much uncertainty surrounds it, and whether the interpretation fits the decision at hand. A band is best treated as a starting point for reflection and observation, not a verdict about a person.
A band is a location on a scale
A personality questionnaire usually produces a score on a dimension or facet. That score is not naturally divided into three boxes. People tend to fall along a continuum, with many nearby values and no universal line where low suddenly becomes average. The report adds bands so a reader can see the broad position quickly.
Low means lower relative to the report's comparison group on the measured dimension. Average means closer to the centre or typical part of that comparison distribution. High means higher relative to the same group. These are directional descriptions, not moral judgments. A high score on one dimension can be useful in one setting and effortful in another, while a low score can describe a different tendency without implying a defect.
The label also does not describe every situation. A person may show a tendency more often, less often, or with more effort, while context, skills, goals, health, relationships, and immediate demands still shape what happens. The report's band is one piece of information about a measured construct.
Why reports simplify continuous scores
A raw score is often just a sum or other combination of item responses. On its own, it may be difficult to interpret. The same raw total can mean something different on another questionnaire, and even the same questionnaire can use different norms or scoring rules. A band provides a compact translation from a numerical position to ordinary language.
Consider an example. Maria reads that one dimension is average and another is high. The useful question is not which label sounds better. She should ask what each dimension represents, what comparison group was used, and whether the report's examples match her repeated experiences. The high label may point to a tendency worth noticing, while the average label may mean the dimension is not especially distinctive compared with that group. Neither label predicts a single behaviour.
Simplification has a cost. Two scores near a boundary may receive different words even though they are practically similar. Two scores with the same word may sit at different points within the band. A readable report should therefore show enough detail, such as the underlying scale or percentile, to prevent the category from appearing more exact than the measurement supports.
The norm group gives average its meaning
A norm group is the group used as a basis for comparison. Norms give an obtained score meaning by showing where it sits within the distribution of scores for that group. The comparison might be broad, local, occupational, age-related, or defined in another way by the instrument. The report should identify it clearly enough for a reader to judge whether it is relevant.
This is why average is not a universal human standard. A score can be average against one reference group and above or below average against another. A report based on a self-selected group may also describe that group rather than a well-defined population. The National Council on Measurement in Education distinguishes user norms from norms representing a defined reference population, a distinction that matters when a label is used to compare people.
Before accepting a band, look for the norm group's description, date, size, and sampling information. A large group is not automatically representative. Relevance and transparency matter too. If the report gives no comparison group or only says that a result is high, the label has less interpretive value than it appears to have.
Low, average, and high do not have fixed cutoffs
There is no single boundary that every personality assessment must use. A developer may set bands using standard deviations from a mean, percentile ranges, equal groups such as quintiles, a transformed scale, or a rule chosen for the instrument's purpose. The report's technical documentation should explain the method.
For example, one professional personality manual converts raw dimension scores into a ten-point standard-ten scale. In that manual, scores in the middle are described as average and scores toward either end receive progressively stronger labels. That illustrates how bands can be designed; it does not establish the correct cutoff for every personality report. Another instrument could use wider middle bands or more categories.
A band is therefore a reporting convention built on a scoring system. It can be useful without being a natural boundary in personality. When a report presents a cutoff as if it were a scientific border between kinds of people, the wording has gone further than the score supports.
Reports may also show a percentile or standardized score beside the band. A percentile is the relative position of a score within a defined group, not the percentage of a trait a person possesses. A standardized score uses a scale whose centre and spread were set from reference data. Neither number can be compared directly across different instruments without documentation showing that the scales were linked.

Measurement error can blur a band
An obtained score is influenced by the answers given on that occasion and by some amount of measurement error. Error can reflect ordinary sources of fluctuation, such as item sampling, attention, response interpretation, or conditions of administration. It does not mean the assessment is useless. It means an individual score should not be read as perfectly exact.
The standard error of measurement is an estimate of the spread of errors associated with scores for a specified group. It can be used to form a score band around an obtained score, although the calculation and interpretation depend on the test and the method used. The National Council on Measurement in Education warns that score bands can be over-interpreted and that error may differ at different points on a scale.
This matters most near a category boundary. If a score is close to the line between average and high, the label may change on another administration without a meaningful change in the person's underlying tendency. A responsible report either supplies uncertainty information or avoids implying that a narrow difference is decisive.
Reliability supports precision, not a personality verdict
Reliability asks how consistently scores are produced under specified conditions. A report may discuss internal consistency, which concerns relationships among items, or test-retest reliability, which concerns scores on different occasions. These are different forms of evidence and can answer different questions.
A reliable score is not automatically a valid interpretation. Validity concerns whether evidence and theory support a particular interpretation of scores for a particular use. The American Psychological Association's testing guidance makes this purpose-specific distinction explicit. A questionnaire can produce consistent scores while still failing to support a claim that goes beyond what it measured.
For a band, ask two separate questions. First, is the measurement precise enough for this level of detail? Second, is the explanation attached to the band supported for this use? The answers may be stronger for self-reflection than for a high-stakes employment decision. A label should not be used to make a consequential judgment merely because it looks tidy on a chart.
The same band can support different observations
A report becomes more useful when the label is translated into observable, testable questions. If a dimension concerns preference for social stimulation, a high label might prompt questions about when interaction feels energizing and when it becomes distracting. If a dimension concerns order or planning, a high label might prompt questions about routines, deadlines, and responses to unexpected change. These are examples of inquiry, not fixed meanings for every instrument.
A person can also show different facets within one broad dimension. An average domain score may contain stronger and weaker facets that partly offset each other. A high domain score may not mean every related behaviour is high. The report's definitions, facet structure, and item content should guide interpretation rather than a familiar trait stereotype.
Use the label to form a modest hypothesis: this tendency may be more noticeable than others in the comparison group. Then look for repeated examples across settings. One memorable incident is weak confirmation. A pattern observed over time, including situations where the tendency does not appear, gives a more balanced interpretation.

What the bands cannot tell you
A low, average, or high label does not by itself diagnose a mental health condition, reveal a person's complete identity, or determine what they will do. It does not establish competence, character, motivation, or job suitability without evidence designed for those claims. Nor does it tell you whether a tendency is desirable in every setting.
The report also cannot remove the need for context. Language, culture, accessibility, response style, current circumstances, and the purpose of testing can affect how a score should be interpreted. The testing standards emphasize that score interpretations need evidence for the intended use and attention to relevant differences among test takers.
Be especially cautious when someone uses a band to rank people, make a clinical conclusion, or justify a major decision without explaining the instrument and its evidence. A general personality report is usually better suited to structured self-reflection or development than to making a decision on its own.
A practical way to read your result
Read the report in this order. Start with the construct definition: what does this scale claim to measure, and what does it leave out? Next identify the score type: raw score, standardized score, percentile, band, or facet result. Then find the comparison group and the rule used to set the boundaries.
After that, look for reliability information and a standard error of measurement or confidence interval. These details show how much precision the report claims. Check whether the narrative uses cautious language such as tendency, more likely, or relative to the group, rather than turning a score into an absolute statement.
Finally, connect the result to a decision with limited stakes. Write down two recent examples that fit the interpretation and one context that does not. If the result concerns development, choose one small behaviour to observe or practise. If the report is being considered for work or coaching, ask what other information is required and whether the instrument was validated for that purpose.
The better question is what the band helps you examine
Low, average, and high bands exist because people need a readable map of a numerical result. The map is useful when it preserves the essentials: compared with whom, measured how, with what uncertainty, and for what purpose. It becomes misleading when the label is treated as a grade or a complete description of a person.
Return to Maria's report. The responsible next step is not to defend or reject the high label. It is to check the construct, norm group, scoring rule, and uncertainty, then compare the interpretation with repeated observations. That turns a category into a question she can investigate.
Use this checklist before acting on any band: identify the construct; name the score type; find the norm group; read the cutoff rule; look for reliability and measurement error; test the narrative against concrete situations; and keep the decision proportionate to the evidence. For more guides on reading assessment results, continue with the live topics library.
Questions readers ask
Does average mean I have no clear personality tendency?
No. Average usually means the score is near the centre of a specified comparison distribution. It does not mean a person has no preferences, that every related facet is moderate, or that behaviour is identical across situations. Read the construct definition and any facet results before drawing that conclusion.
Can a personality score move from average to high?
Yes, the reported band can change because of ordinary score fluctuation, a different norm group, a different instrument, a changed response context, or a real change in the measured tendency. A small movement near a cutoff should not be treated as proof of a major personality change. Check the score scale and measurement error before comparing results.
Sources and notes
- Standards for Educational and Psychological Testing: Glossary of Terms
Defines norm groups, norms, percentile ranks, observed scores, and the meaning added by comparison data.
- Understanding Psychological Testing and Assessment
Explains norm-referenced testing and why assessment information is interpreted in relation to the question being asked.
- Standard Error of Measurement
Explains measurement error, standard error of measurement, score bands, and cautions about over-interpreting individual scores.
- NCME Glossary
Defines reference populations, user norms, cut scores, reliability, validity, test manuals, and intended score uses.
- Saville Wave Professional Styles Handbook, Chapter 18: Norms
Provides an instrument-specific example of norm comparison, standard-ten bands, percentiles, and the limits of apparent precision.
- APA PsycTests Methodology Field Values
Distinguishes validity as support for a score interpretation from reliability as consistency across replications.
- Ethics Rounds: Test-Scoring and Interpretation Services
States that assessment use should account for purpose, norms, validity, reliability, applications, and appropriate interpretation.
Apply it to your work
Understand how you work before you choose what comes next.
From this guide: Use the band as a hypothesis for reflection or discussion, not as a standalone reason to label yourself or decide another person's future.
The Work Pattern Report maps how you decide, plan, collaborate, handle conflict, adapt, and learn across 100 workplace situations. Use the result to ask sharper questions about a role’s demands. It is a private reflection tool, not a job recommendation or hiring score.