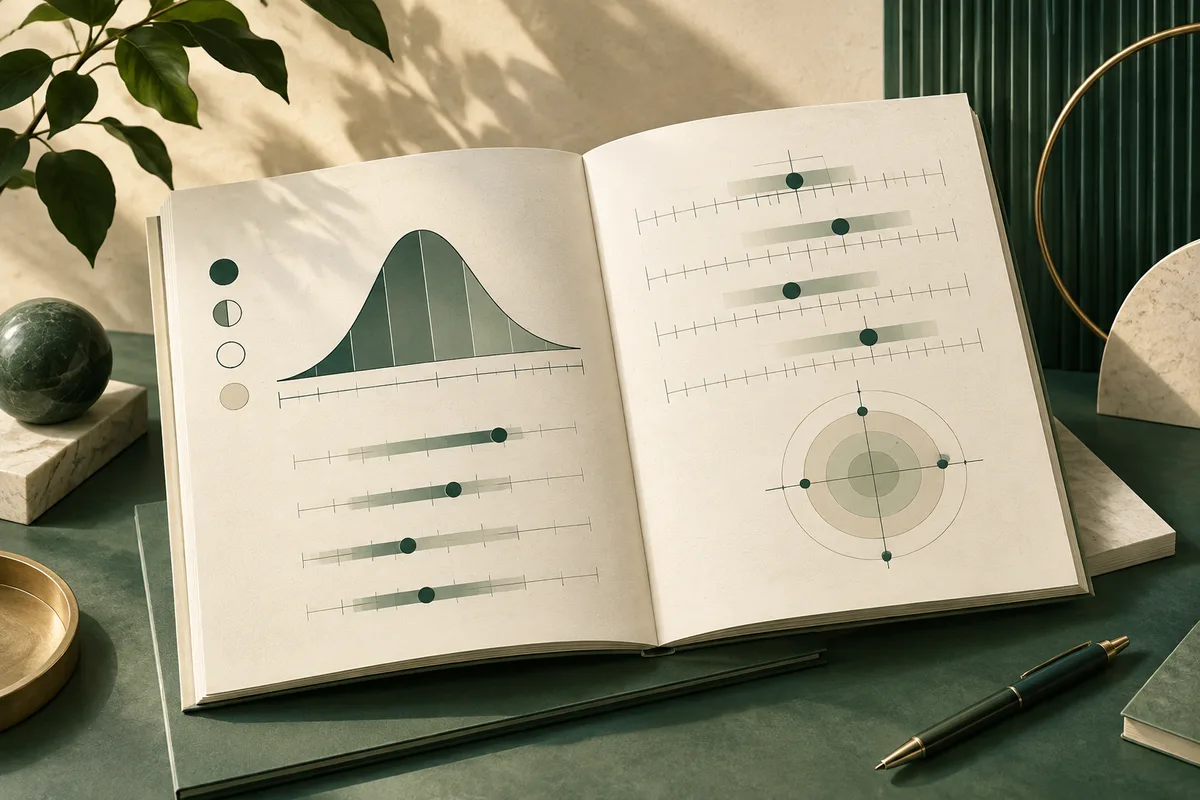
A z score tells you how far a reported result is above or below the mean of a reference group, measured in standard deviations. A T score expresses the same position on a more reader-friendly scale whose mean is 50 and whose standard deviation is 10. The usual conversion is T = 50 + 10z. Thus, z = 0.80 and T = 58 describe the same relative position, assuming the report used the same norm group and a linear conversion. Neither number is a grade, diagnosis, or universal personality rating. To read either score responsibly, identify the construct, the norm group, the scoring method, any percentile or band, and the measurement uncertainty supplied by the instrument.
The decision behind the number
Suppose a report gives you a T score of 58 for a trait and another document gives you a z score of 0.80. You may wonder whether one result is stronger, more serious, or more trustworthy. The first decision is simpler: are these two numbers describing the same construct against the same reference distribution? If yes, they may be different labels for the same location. If not, the numbers should not be compared just because both look standardized.
A personality score is an observed result from a particular instrument, administration, and interpretation rule. It is not a direct reading of a fixed inner quantity. The testing standards describe validity as evidence supporting a score interpretation for a specified use. That means a report should say what its score is intended to mean, for whom, and in what setting. A score that helps with self-reflection does not automatically justify a prediction about work performance or a clinical conclusion.
What a z score measures
A z score puts a result into standard-deviation units. The formula is z = (X − M) / SD, where X is the person’s score, M is the reference group’s mean, and SD is that group’s standard deviation. A standard deviation is a summary of how spread out the scores are. A z score of 0 is at the reference mean. A positive z score is above it; a negative z score is below it.
For an illustrative calculation, imagine that a particular scale has a raw-score mean of 42 and a standard deviation of 5 in the norm data. A raw score of 46 gives z = (46 − 42) / 5 = 0.80. The result is 0.80 standard deviations above that group’s mean. This example explains the calculation only. It does not establish a cutoff, a desirable level, or a norm for any real personality instrument.
The reference group matters in every part of that sentence. The mean and spread might come from a publisher’s norm sample, a defined workplace population, or another documented group. If the report does not identify the group, date, language, or relevant demographic information, you cannot tell what ‘above average’ means in that report. A z score without its reference frame is incomplete.
What a T score changes
A T score is a rescaled standardized score. In the common T-score metric, the mean is 50 and the standard deviation is 10. The conversion from a z score is T = 50 + 10z. The reverse conversion is z = (T − 50) / 10. The rescaling usually avoids negative values in common reporting ranges and reduces decimals, which can make a report easier to scan.
Using the same illustrative z score, z = 0.80 becomes T = 50 + 10(0.80) = 58. A z score of −1.20 becomes T = 38. The distance from the mean is unchanged: both results are 0.80 or 1.20 standard deviations from the reference mean. The T number has not added a new personality feature. It has changed the ruler.
The word ‘T’ does not guarantee one universal interpretive system. A publisher can use a T-like scale with a different transformation, apply separate norms, or convert through a non-linear process. Check the report’s technical notes instead of assuming that every T score was created in the same way. If the report says ‘normalized T score,’ its relationship to the original raw distribution may involve additional steps.

What the two scales have in common
When the conversion is linear and the reference group is the same, z and T scores preserve ordering and relative distance. T 60 is one standard deviation above the mean, just as z = +1.00 is. T 40 corresponds to z = −1.00. A difference of 10 T points represents one standard-deviation unit on that T scale.
This makes the two formats useful for different reading tasks. A z score is compact for statistical work and makes the distance from the mean explicit. A T score is often more approachable in a report because 50 is the center and each 10-point step represents one standard deviation. Neither scale tells you whether the measured tendency is helpful, harmful, or important without the construct and purpose.
Do not turn the scale into a moral ranking. A higher score on assertiveness, caution, emotional reactivity, or another construct does not carry the same practical meaning across instruments. Even a percentile describes relative standing, not quality. The report’s description of the construct and intended use must do the interpretive work.
Where percentiles fit, and where they mislead
A percentile rank describes the proportion of the reference group with a lower score, using the instrument’s stated calculation rule. In an approximately normal distribution, z = 0 is near the 50th percentile, z = +1 is near the 84th, and z = −1 is near the 16th. Those familiar conversions are approximations tied to a distributional assumption, not a promise that every personality scale follows a bell curve.
Percentiles are also uneven units. The distance between the 50th and 60th percentiles does not represent the same score distance as the distance between the 90th and 100th. A percentile of 75 can be only modestly above the mean on a T scale, while small T-score changes near the upper tail can correspond to larger percentile changes. For a practical comparison, read the score’s distance from the norm mean and the percentile together, if both are provided.
If the raw scores are skewed, a simple linear conversion can make the familiar percentile landmarks a poor guide. Some systems first transform the distribution or use empirical norm tables. Ask whether the report’s T score is linear, normalized, or directly looked up from a norm table. This is one reason a report should explain its scoring method rather than display a number alone.

What a score cannot tell you by itself
A z or T score does not reveal how precisely the instrument measured the construct. Reliability and measurement error are separate from the score transformation. The Standards define the standard error of measurement, or SEM, as an estimate of the average error in scores for a population. A larger SEM indicates lower precision, and an SEM can be used to create an interval around a reported score.
For example, if a report documents an SEM of 4 T points, a reported T 58 should not be treated as an exact boundary between ‘58’ and ‘57.’ The appropriate interval depends on the reporting convention and confidence level, which the instrument should state. This is an illustration of how to think, not an estimate for a particular test. Conditional SEMs may also differ at different score levels.
A reliability coefficient alone does not settle the question. Different coefficients address different sources of error, such as item consistency or stability across occasions. A score can be consistently produced and still support a weak interpretation if the items do not represent the intended construct or if the proposed use lacks validation evidence.
A responsible comparison of two reports
When two reports disagree, compare the measurement systems before comparing the numbers. Start with the construct: are both instruments measuring the same trait, or are similar words being used for different definitions? Next check the norm group, because a score standardized against one population may move when compared with another. Then check whether one report uses raw scores, linear standard scores, normalized scores, percentiles, or broad bands.
A valid-looking conversion does not make unrelated tests interchangeable. Two T scores of 58 can be placed on the same numerical ruler, but they may come from different constructs, item content, norm samples, and error estimates. Even within one report, a facet based on fewer items may be less precise than a broad domain score. Treat close differences as especially weak evidence when the report’s uncertainty is similar in size to the difference.
Finally, ask what decision the report is being used to support. For self-reflection, the result may be a prompt to examine recurring situations and alternatives. In coaching, it may help organize a conversation alongside observations and goals. In selection, a score requires evidence for that specific use, attention to fairness, and a process that does not treat one personality number as a complete forecast. A general personality report is not a diagnosis.

The short report-reading checklist
Before deciding what a z or T score means, write down the answer to six questions: What construct is being scored? What does a high value mean on this instrument? Which norm group supplies the mean and standard deviation? Is the score a linear or normalized transformation? What percentile, band, or description accompanies it? What reliability or measurement-error information is reported?
Then make the interpretation proportional to the evidence. A score can suggest a tendency worth observing, not dictate an identity. Record one or two concrete situations in which the description fits and one in which the situation, role, language, or current state may have changed the expression. If the score would affect a job, health, or other high-stakes decision, ask for the instrument’s intended-use evidence and qualified interpretation before acting.
The practical conclusion is usually modest: z and T scores tell you where a result sits relative to a defined reference distribution. They do not tell you who you are in every setting. For more report-reading guidance, continue with the live /topics library and use the checklist above when a report gives you a number without enough context.
Questions readers ask
Is a T score of 60 the same as a z score of 1?
On the common T scale, yes. T = 50 + 10z, so z = 1 converts to T = 60. The equivalence holds only when both scores use the same construct, reference group, and stated linear transformation.
Is a higher T score better in a personality assessment?
Not by itself. Higher means farther in the positive direction of that instrument’s scale. Whether that direction is useful, difficult, or neutral depends on the construct, context, and intended use.
Why does my percentile not seem to match my T score?
The familiar percentile conversions assume an approximately normal distribution. A report may use an empirical norm table, normalized scores, rounding, or a skewed reference distribution. Check its scoring notes and norm group.
Should I compare T scores from two personality tests?
Only cautiously. First confirm that the constructs, norm groups, score transformations, intended uses, and uncertainty information are comparable. Equal numbers do not prove that the tests measure the same thing.
Sources and notes
- Standards for Educational and Psychological Testing
Supports the claim that score validity is interpretation- and use-specific, and that developers should describe constructs, populations, contexts, and scoring processes.
- NIST Dataplot: Standardize
Supports the definition of a z score as subtracting the mean and dividing by the standard deviation.
- APA Dictionary of Psychology: Norm-Referenced Test
Supports the explanation that norm-referenced scores are interpreted by comparison with a specified group.
- APA Dictionary of Psychology: Standardized Score
Supports the definition of standardized scores and the distinction between raw units and standard-score units.
- Pearson Assessment Primer: Standardized Clinical Assessment Scores
Supports the common T-score metric of mean 50 and standard deviation 10, plus approximate normal-curve percentile relationships.
- Common measures or common metrics? A plea to harmonize measurement results
Supports the linear T-score formula and the cautions about skewed distributions, unequal percentile intervals, and interpreting T scores as distance from a reference mean.
- University of Minnesota: Descriptive Statistics Report
Supports the practical distinction between percentile rank and standard score and the use of standard scores for comparing differently scaled results.
- Standards for Educational and Psychological Testing: Standard Errors of Measurement
Supports the explanation that SEM summarizes score error, indicates precision, and can be used to form intervals around reported scores.
Apply it to your work
Understand how you work before you choose what comes next.
From this guide: Carry this report-reading question into the work decision in front of you.
Build a private Work Pattern Report across ten workplace continuums, then compare the result with the demands of the role or environment in front of you.