
Two people can receive different percentiles for the same personality score because a percentile is a comparison, not a property stored inside the raw score. It shows how that score ranks within a defined norm group, such as a sample chosen for a particular age range, language, country, or assessment purpose. If two reports use different comparison groups, the same raw score can occupy different positions in the two score distributions. A report may also use a different scoring scale, a subgroup conversion table, a revised norm set, or a rounded score. If the same instrument, scoring rules, norm group, and percentile convention are used, the same unrounded score would normally receive the same percentile, apart from details such as rounding or tied scores. The useful question is therefore not which percentile sounds better. Ask: compared with whom, on which version of the instrument, and with what uncertainty?
A percentile is a comparison, not a second personality score
A raw score is the amount produced by the scoring rules. In a questionnaire, it may be a sum or transformed combination of item responses. By itself, it does not tell you where the score sits relative to other people. A percentile rank supplies that missing comparison. It estimates the percentage of a defined reference group whose scores fall below, or at or below, a given score, depending on the reporting convention.
That definition makes the answer to the reader's question straightforward. The raw score can remain unchanged while the reference distribution changes. A person is not becoming more or less conscientious, sociable, or emotionally reactive merely because a report uses another norm table. The reported position has changed. The underlying construct, the items, the scoring rules, and the comparison group must be kept separate when reading the result.
The comparison group does the hidden work
A norm group is the group whose scores are used to give a test result a relative meaning. It might be broad or narrowly defined. The documentation may describe age, education, location, language, culture, occupation, clinical status, or another feature of the sample. Some instruments use one general set of norms. Others provide separate tables or adjustments for groups the developers believe should be compared separately.
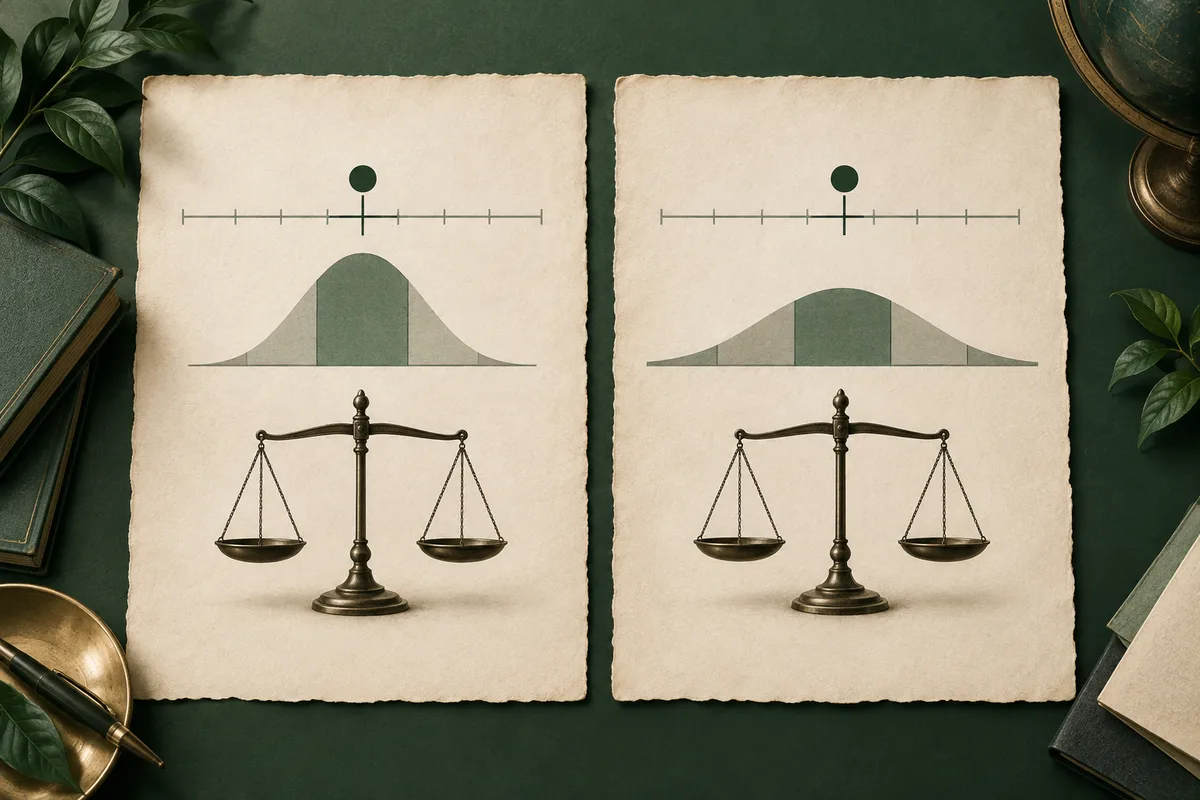
The group matters because distributions differ. Suppose two reports both use the same raw score for the same scale. In one reference group, most scores might fall below that point, placing the score relatively high. In another, scores might cluster above it, placing the identical score relatively lower. Neither percentile is a universal rating. Each answers a local question: how does this score compare with this particular group under this scoring system?
A worked example: one raw score, two reference tables
Consider an example with two people who each receive the same raw score on the same personality scale. Report A compares that score with Norm Group A. Report B compares it with Norm Group B. If the score distribution in Group A is generally lower, the shared score can appear at a higher percentile there. If Group B has higher scores overall, the identical raw score can appear at a lower percentile. The difference comes from the conversion table, not from a hidden difference between the two people.
Now change only one detail: both reports use the same norm group, but one report rounds the raw score before converting it and the other uses more precise values. Nearby percentile ranks may differ. A similar issue can arise when many people share a score. One publisher may use a rule based on scores below the point; another may include some or all tied scores. A small difference in the displayed percentile is not automatically a meaningful difference in the measured tendency.
This example is a way to trace the calculation, not evidence about any named assessment. To evaluate a real report, find the instrument's scoring documentation and identify the exact table or algorithm used. Without that information, two polished-looking percentiles may not be comparable.
Raw, standardized, and percentile scores are different things
Reports often place several numbers beside one another. A raw score is tied to the instrument's item scoring. A standardized score is a transformed value intended to put results on a common scale, often by using the reference group's average and spread. A percentile rank is an ordered position within a group. These numbers can describe the same result, but they do not have the same units or meaning.
A percentile is also not a percentage of items answered in a particular way. A result near the upper part of a percentile scale does not mean that the same proportion of the questionnaire was answered positively, nor does it mean that the person has that proportion of a trait. It means the score occupies a position in a specified distribution. Percentile units are uneven: the score distance between two nearby percentile points need not represent the same amount of the construct as an equally sized gap higher up the scale.
Why the same named trait may still not be comparable
Two reports can use the same everyday label while measuring different item sets, facets, response formats, or models. One may define a scale through self-descriptions; another may combine several narrower facets. Their raw scores are not automatically interchangeable, and their percentiles are not automatically comparable just because both reports use a familiar word such as openness or agreeableness.
The report should identify the instrument, scale definition, scoring direction, and norm source. If those details are missing, treat a cross-report comparison as a language comparison rather than a measurement comparison. You may be able to say that both reports discuss a related area. You cannot safely conclude that a higher-looking percentile in one is higher, stronger, or more accurate than a lower-looking percentile in another without evidence that the scores are linked and interpreted on compatible terms.
Norms can be updated, narrowed, or chosen for a purpose
A report's norm set may have a publication date, edition, or version. Developers can update norms when the intended population changes or when a new sample is collected. A newer norm set is not automatically better for every decision, and an older one is not automatically useless. The relevant question is whether the group matches the people and purpose for which the result will be used.
A report may also use a special comparison group because it is designed for a particular setting. That can be useful when the purpose calls for it, but it changes the meaning of the percentile. A position among people selected for a job, a coaching program, or a research sample is not the same as a position in a broad community sample. Read the purpose statement before treating the number as a general description.
A percentile does not remove measurement uncertainty
Every observed score contains some uncertainty. Responses can vary with attention, wording, language, current circumstances, and the limited set of items used to represent a broad tendency. A reliability estimate addresses consistency under specified conditions. It does not by itself prove that the instrument measures the intended construct or that a percentile supports every decision a reader might want to make.
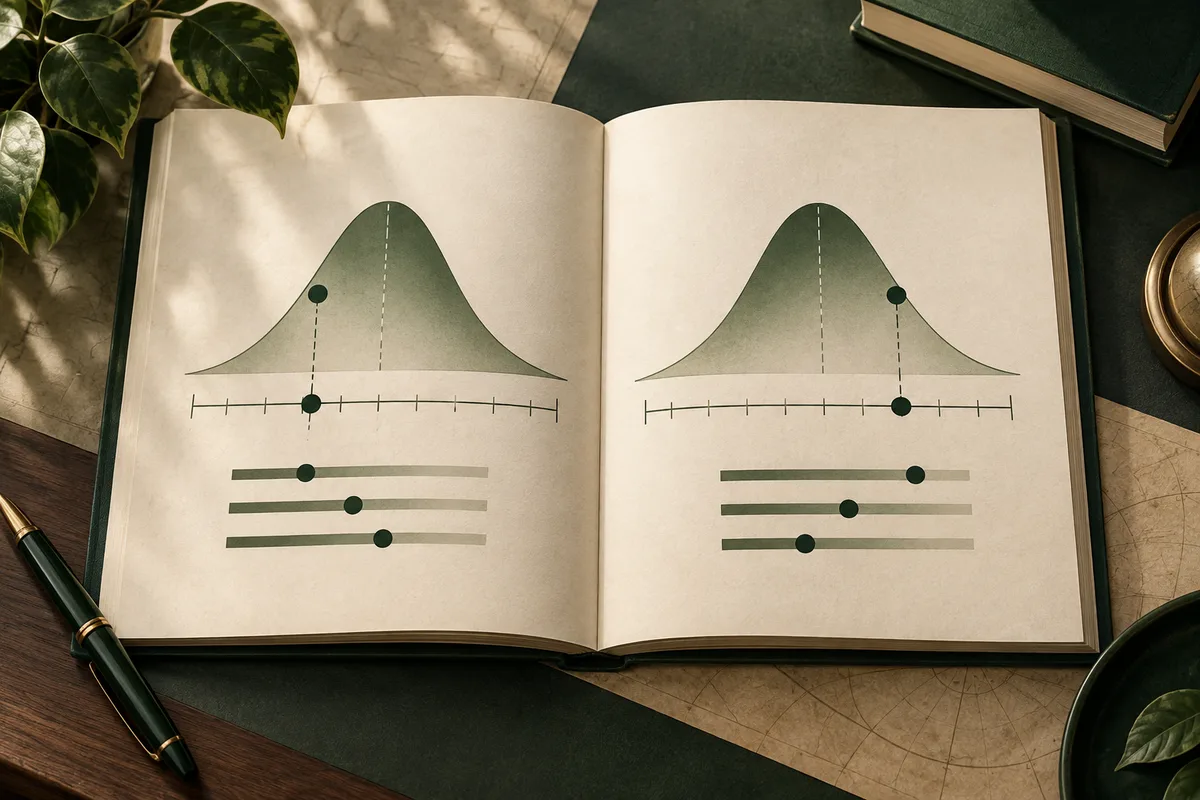
Uncertainty matters most near a boundary. If a report places neighboring percentile ranks into different descriptive bands, that line may look sharper than the measurement warrants. Ask whether the manual reports a standard error of measurement, a confidence interval, a score band, or guidance against overinterpreting small differences. A percentile should be read as an estimate of relative position, not as a precisely observed rank carved into the person.
What the percentile can and cannot support
A percentile can help you describe relative standing within the stated comparison group. It can support a cautious reflection such as, “This report places my score above many people in its reference sample.” It may help a reader decide whether to inspect a scale, discuss a pattern in coaching, or compare results over time when the same method and conditions are used.
It cannot, by itself, establish a diagnosis, a fixed identity, a moral quality, or a prediction about how someone will behave in every setting. It does not show that a person is better or worse. Nor does it establish that a small percentile difference is meaningful, that a trait caused an outcome, or that one person will perform better at work. Those claims require separate evidence, a suitable design, and an appropriate use case.
A practical checklist for reading two reports
When two people have the same displayed score but different percentiles, record the details before interpreting the difference. Start with the instrument name and edition. Then look for the scale definition, whether the number is raw or transformed, the norm group's description and date, and the rule used to calculate the percentile. Check whether the displayed score was rounded and whether tied scores are handled explicitly.
Next, ask what decision the report is meant to support. Self-reflection and coaching can use a result as a prompt for questions and observations. Employment selection demands stronger evidence about the specific job, fairness, and the intended inference. A general personality report should not be treated as a clinical diagnosis. If the documentation does not state the norm group or intended use, mark the percentile as limited rather than filling the gap with assumptions.
The useful conclusion is about fit, not rank
The same personality score can receive different percentiles because percentile ranks belong to norm groups. The number becomes interpretable only when you know which group, scoring rule, version, and purpose produced it. When those conditions match, a difference may point to rounding, ties, or measurement uncertainty. When they do not match, the percentiles answer different questions.
Before acting, write down the raw or standardized score, the comparison group, the report date, and the uncertainty information. Use the result to form a modest question about observable patterns, then check that question against repeated behavior and context. If two reports still conflict, ask the publisher or qualified professional to explain the scoring and intended use. For more practical assessment-literacy guidance, continue through the live topics library.
Sources and notes
- Testing Standards
The joint AERA, APA, and NCME standards support appropriate score interpretation, fairness, and attention to intended test use.
- Scales, Norms, and Equivalent Scores
This ETS research report defines percentile-rank scales and explains how their meaning depends on the group used for the comparison.
- Norm-referenced test
The APA Dictionary describes norm-referenced interpretation as comparison with a specified group's typical performance.
- Professional practice guidelines for occupationally mandated psychological evaluations
APA guidance distinguishes reliability from validity and emphasizes using assessment methods for purposes supported by evidence.
Apply it to your work
Understand how you work before you choose what comes next.
From this guide: Decide whether the two percentiles answer the same question before deciding whether they conflict.
The Work Pattern Report maps how you decide, plan, collaborate, handle conflict, adapt, and learn across 100 workplace situations. Use the result to ask sharper questions about a role’s demands. It is a private reflection tool, not a job recommendation or hiring score.