
A personality report can show a percentile without naming its comparison group because the scoring table may be built into the provider's software while the reader sees only the final result. That makes the number look more complete than it is. A percentile is a relative position: it tells you how a score compares with scores in a defined norm group, not how much of a trait you possess and not how you will behave. If the report does not identify that group, you cannot tell whether the comparison is with a general population, people of a particular age, an organization, a clinical sample, or the test provider's own respondents. You also cannot judge whether the group fits your question, whether the norms are current, or whether a small difference is meaningful once measurement error is considered. Treat the percentile as an incomplete label. Ask for the norm group's composition, date, sample size, score direction, and the uncertainty around the score before using it for a consequential decision.
The claim under review: a percentile should stand on its own
The claim sounds plausible because a percentile looks self-explanatory. A number such as 70 appears to come with its own scale, and many reports place it beside words such as average, elevated, or strong. But a percentile is not a self-contained measurement. It is a location in a distribution.
The testing standards define a norm group as the group of test takers used as a basis for comparison. A percentile rank is the percentage of that defined group who scored below a particular score, subject to conventions for tied scores. The missing group is therefore not a footnote. It is part of what the percentile means.
The narrow verdict is simple: a report may calculate a percentile correctly and still report it poorly. The arithmetic can be transparent to the scoring system while the interpretation remains opaque to the reader. An unexplained percentile can support a cautious statement about relative standing. It cannot support a confident statement about a person's general level, quality, likely behavior, or suitability for a role.
Why the comparison group can disappear
There are several ordinary reasons a reader may not see the group. The report may be a short consumer summary whose technical details are kept in a manual. The provider may use a common conversion table for every report and assume that the label is obvious from a help page. A dashboard may show a graph but omit the table that explains the graph. Or the result may use a local or user-selected comparison group that is not named in the visible report.
The omission does not prove that the instrument is invalid. It does create an interpretation problem. Professional guidance says that validation begins by stating what is measured, the purpose of the test, the claims to be made, and the population for which it is designed. A reader needs those same pieces to understand whether the displayed percentile answers the question they actually have.
A group can also be hidden by vague wording. ‘Compared with others’ leaves open who those others are. ‘Compared with the population’ leaves open which population, where it was recruited, when the data were collected, and whether the group resembles the people now taking the test. A report that names only a country, or only the word general, may still leave important questions unanswered.
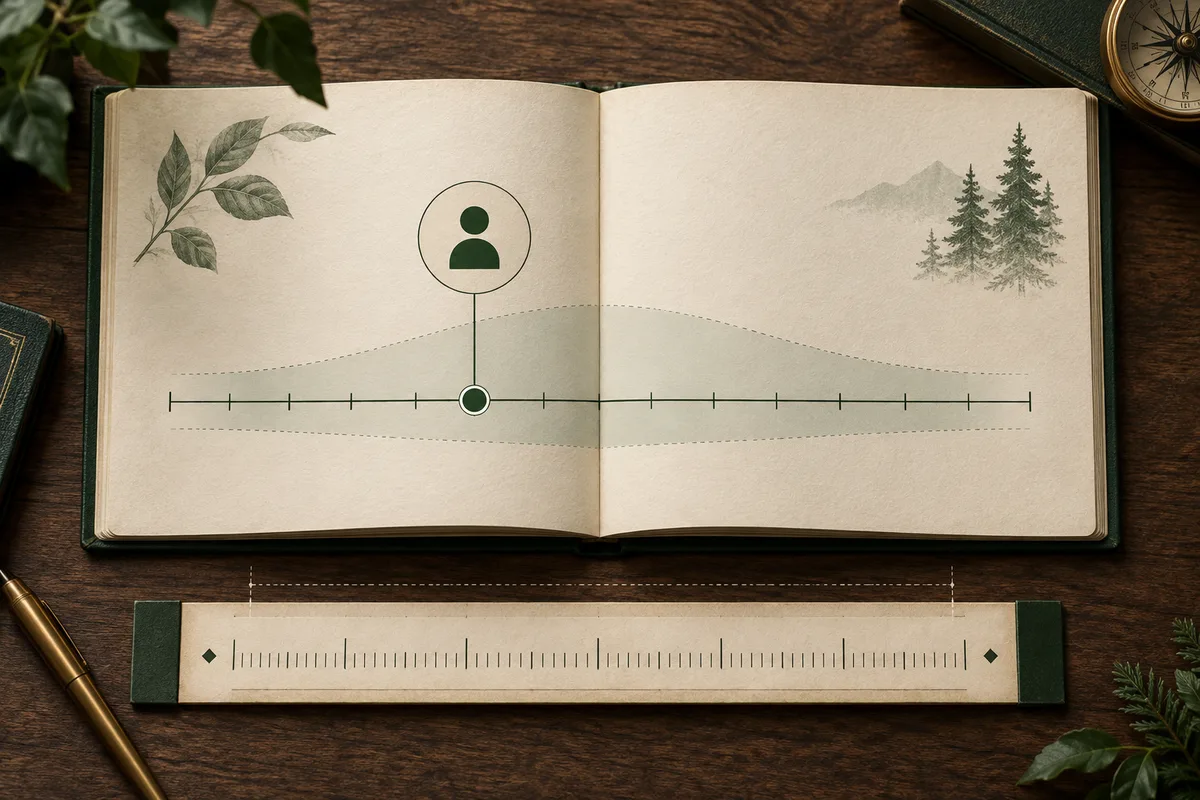
What changes when the group changes
The same observed score can receive different percentiles under different reference distributions. This is not a contradiction. It is the expected result of changing the frame of comparison. A score may sit near the middle of a broad community sample but lower or higher within a selected occupational group, age band, language population, or organization. Without the group, the reader cannot know which of those comparisons is being made.
An official personality-report example makes the dependency visible. Its profile lists percentiles for both General Combined and General Gender-Specific norm groups. Its detailed score tables, however, are headed General Combined Norm Group and show the 90 percent confidence intervals there. That is a useful distinction: a report can display several norm-based views while giving detailed uncertainty information for one specified reference group. The number gains meaning from the labels and table headings beside it. Remove that description and the number remains, but the comparison does not.
This also explains why percentiles from two different personality reports should not be lined up as if they were units on one shared ruler. Different instruments can measure different constructs, use different items, convert raw scores differently, and norm their results against different groups. Even when both reports use the word percentile, their numbers may answer different comparison questions.
A missing group hides more than demographics
The useful comparison is not simply ‘named group’ versus ‘unnamed group.’ Look for four layers of context. First is composition: who was included, and were age, language, culture, education, or other relevant characteristics considered? Second is recruitment: did the group come from a general population, volunteers, customers, employees, students, or people already seeking help? Third is timing: when were the data collected, and are the norms still intended for current use? Fourth is purpose: are the norms meant for self-reflection, development, selection, screening, or another use?
These layers matter because a norm group is a reference, not a universal standard. A group recruited for one purpose may not represent the people or decisions in another setting. A local organizational norm can describe relative standing inside that organization without telling you how the person compares with a wider population. A clinical comparison group can be useful for a clinical question but inappropriate for turning a general report into a diagnosis.
The standards also distinguish the score from the inference drawn from it. Evidence that a test produces consistent scores does not by itself show that a particular interpretation is accurate or useful. The intended population and intended use have to match the claim. A percentile with no comparison group makes that match harder to inspect.

Why a precise-looking percentile can still be uncertain
Even a fully named norm group does not turn a test result into a perfectly exact reading of a person. An observed score can vary because of the particular items presented, temporary conditions during testing, response patterns, or other parts of the testing process. Measurement error is the variation that is not the intended construct. The standard error of measurement is one way a report can show how much uncertainty surrounds a score.
A strong report therefore may place a confidence interval around a standardized score and explain how to use it. In the BASC-3 example, the detailed tables place a percentile beside a T score and a 90 percent confidence interval under the General Combined norm-group heading. The profile also displays percentiles for a General Gender-Specific norm group, but the cited interval table should not be read as a separate interval estimate for every displayed norm group. The report's notes caution that score classifications should take the standard error of measurement into account. The example is not a template for every instrument. It demonstrates the principle that a single point should not carry more precision than the evidence supports.
There is uncertainty in the norms as well. The reference distribution is usually estimated from a sample, and sampling choices affect how well it represents the intended population. A percentile can therefore be affected both by uncertainty in the individual's score and by uncertainty in the reference data. If two nearby report categories would lead to different action, the provider should explain the uncertainty relevant to that boundary.
What the percentile does not tell you
A percentile is not a percentage of a trait. The 70th percentile does not mean that 70 percent of your personality is present, that you answered 70 percent of the items in a particular way, or that you will display a behavior 70 percent of the time. It describes rank within the comparison distribution.
It is not a diagnosis. A general personality report may describe self-reported tendencies or another defined construct, but a percentile alone does not establish a mental disorder, cause, impairment, or treatment need. It is also not a moral grade. ‘High’ and ‘low’ are relative descriptions, and whether a tendency is helpful depends on the situation and the decision being made.
It is not a prediction by itself. To support a prediction, a provider needs evidence for the specific outcome, population, and use. The testing standards describe validity as evidence supporting intended interpretations and actions, not as a permanent property that makes every use of a test acceptable. A percentile can be useful for structured self-reflection while being insufficient for hiring, diagnosis, or a high-stakes judgment about another person.

A practical audit before you act on the number
Start by asking the provider for the technical explanation behind the report, not for a more flattering label. Record the exact scale name and what it is intended to measure. Then ask which score is being ranked: a raw total, a standardized score, a facet, or a composite. These are different layers, and a percentile cannot tell you which one was used.
Next, look for the comparison group's identity and boundaries. The report should say who the group represents, how it was formed, when its data were collected, and whether separate norms were used for relevant populations. Ask whether the displayed percentile is norm-referenced or whether the report is using a criterion or cutoff rule. A criterion comparison asks how a score relates to a defined standard; it is not the same as ranking people against one another.
Finally, check the uncertainty and the intended decision. Is there a standard error, confidence interval, or guidance for interpreting close scores? Is the evidence for the intended use available for this population? If the report is being considered for work or coaching, ask who can see the result, what decision it will influence, and whether other relevant information will be considered. If the provider cannot answer these basic questions, use the percentile only as a prompt for inquiry, not as a verdict.
A compact checklist is: construct, score type, norm group, norm date, sample description, score direction, uncertainty, intended use, and data access. Missing information does not automatically make a report worthless. It does tell you how much confidence to place in the interpretation and whether a consequential decision should wait.
Sources and notes
- ETS Standards for Quality and Fairness
Defines norm group, percentile rank, measurement error, and norms, and explains why score meaning depends on the comparison group.
- Standards for Educational and Psychological Testing
The joint AERA, APA, and NCME standards explain that validity concerns intended score interpretations and uses, and provide guidance on norms, reporting, and measurement error.
- Scales, Norms, and Equivalent Scores
Explains that norming, scaling, and score interpretation are separate operations and discusses national, local, and special-study norms.
- Professional Practice Guidelines for Occupationally Mandated Psychological Evaluations
Supports matching instruments and interpretations to the population and purpose, and distinguishes reliability from sufficient validity.
- BASC-3 Self-Report of Personality: College Interpretive Summary Report
Shows a personality-report format with two named norm-group percentile rows, detailed 90 percent intervals under the General Combined heading, and a caution about standard error in classifications.
Apply it to your work
Understand how you work before you choose what comes next.
From this guide: Carry this report-reading question into the work decision in front of you.
Build a private Work Pattern Report across ten workplace continuums, then compare the result with the demands of the role or environment in front of you.