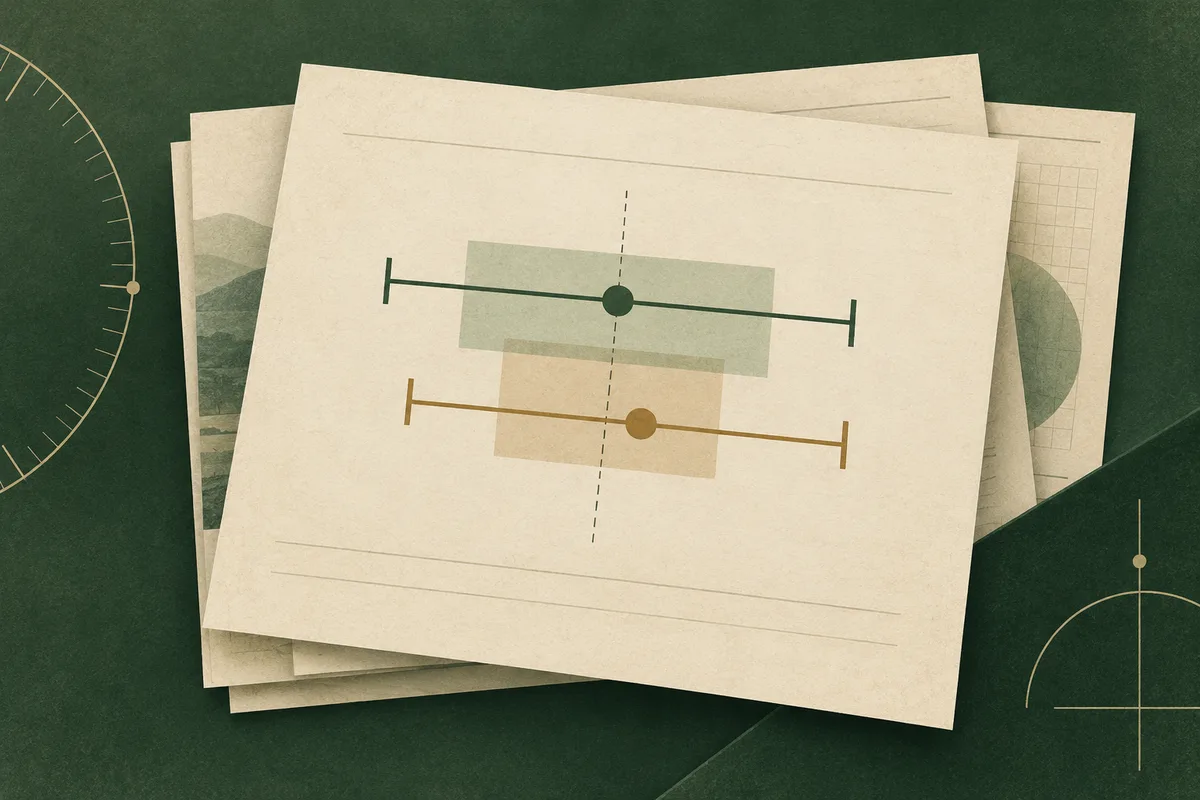
No—not from the two separate intervals alone. They describe uncertainty around each score, not the uncertainty in the gap between them. A defensible contrast requires comparable scales and a documented method for the specific score pair and purpose. Without one, report only a supported ordering of point estimates and leave whether the scores really differ unresolved.
Can a personality report’s confidence interval show whether two trait scores really differ?
Not by itself. A confidence interval around each trait score describes uncertainty for that score under the report’s method; it does not automatically show how uncertain the gap between the two scores is. That gap is a separate quantity, and interpreting it requires both scales to have meanings that can be compared and a method designed for their contrast. No assessment is named here, so this answer is conditional: an instrument’s documented, applicable profile-comparison rule could support a bounded conclusion, but two displayed intervals alone cannot establish one.
The useful next question is therefore not simply whether the bars overlap. It is whether the report or its technical documentation defines a comparison for this exact pair of scales, explains what that comparison supports, and fits the purpose for which you are reading the result.
A report might also show a scale label, percentile, or shaded band, but the display alone cannot establish that two scales share units or a common interpretive frame. Those details affect whether subtraction has a coherent meaning before any uncertainty calculation is considered. The interval question and the comparability question are related, but neither can be answered from visual spacing alone.
Why do separate intervals not settle the gap?
A confidence interval is a range produced by a specified procedure for a specified parameter, under its assumptions. The important question is what parameter the procedure targets. If a report gives an estimate for score A and another for score B, each interval concerns its own estimate. The question “How far apart are A and B?” targets a third quantity: A − B. Its uncertainty must be estimated for that difference, not inferred automatically from the two score intervals as if their endpoints were themselves a difference interval.
This distinction is about the target of the calculation, not a peculiarity of personality tests. The Association for Psychological Science’s explainer, “Understanding Confidence Intervals (CIs) and Effect Size Estimation,” discusses paired or repeated group means: researchers can calculate an interval for the mean of the paired differences, while separate intervals around each group mean answer different questions. That is an analogy only. It clarifies why a direct difference has its own uncertainty calculation; it does not establish a rule for two scores in one person’s personality report.
For two scores from one person, the estimates may be related because they come from the same respondent and assessment. Their joint behavior matters to the precision of A − B. Knowing where an interval for A begins and ends and where an interval for B begins and ends does not, on its own, tell the reader how their estimation errors move together or what comparison rule the publisher intended. A valid method for one scale’s score interval is not automatically a valid method for a contrast between scales.
This is why overlap is not a universal significance test. Overlapping score intervals do not prove that the underlying scores are equal, and non-overlapping intervals do not supply the missing, person-level procedure for estimating the uncertainty in their difference. Depending on a specific design and its assumptions, relationships between intervals can sometimes approximate a test of independent group means. That special case does not transfer automatically to correlated scores within one person, and a report graphic may not even state the assumptions needed to use such a shortcut.
The distinction can be written without inventing numbers: the report displays an estimate for A with its interval and an estimate for B with its interval; the desired contrast is A − B. To assess that contrast, a procedure must define the relevant scale and estimate uncertainty for the difference using the information its method requires, including any dependence between A and B. Simply subtracting interval endpoints can yield a range, but without a documented method it is not established as a confidence interval for the contrast.
A specialized profile manual could provide a comparison rule for named scales, including a defined purpose and interpretation. If so, that rule may support a conclusion within its stated scope. The key is that the procedure must actually address the pairwise comparison; the presence of two separate intervals, even when carefully calculated, does not show that it does.
The Association for Psychological Science’s group example also shows why the data structure matters: paired observations allow the calculation to retain the relationship within each pair when estimating the mean difference. In an individual profile, the corresponding relationship between scale scores would need to be handled by the instrument’s appropriate method, not borrowed from the group illustration. The analogy helps identify the missing target; it does not supply the formula or assumptions for a personality assessment.
Thus, the bars can describe two score estimates accurately and still leave the reader’s comparative question unanswered. A direct contrast is a distinct reported result, with its own defined target and assumptions.
Sources: Understanding Confidence Intervals (CIs) and Effect Size Estimation
What kind of uncertainty does the report’s interval represent?
Before interpreting a printed interval, identify what quantity it surrounds. A report may display a score estimate and a range intended to express uncertainty about that individual score, but “confidence interval” alone does not tell you the target. Ask whether the documentation treats the center as an observed standardized score, an estimate of a person’s latent or true score, or a prediction of the score expected for that person given population information. Those targets can produce different ranges while using the same label. The documentation may also specify whether the range is symmetric, how scores near a scale boundary are handled, and whether the displayed limits were rounded; these presentation choices affect reading, though they do not identify the target by themselves.
Under classical test theory, the standard error of measurement (SEM) describes the spread of measurement error around scores for a defined test and population under the model’s assumptions. It is often used to construct a range around an observed score as an estimate of the person’s true score. That interpretation depends on the manual’s reliability evidence, score scale, and assumptions; SEM is not a universal property of a trait independent of the instrument and population. The interval also does not automatically describe how much a future sitting will vary, how precisely the population mean is known, or how uncertain the norm sample’s reference values are.
A regression-based interval can instead use a person’s observed score and information about the population relationship between observed and latent scores to estimate an individual value. Such a method may pull an extreme observed score toward the population average, a process commonly called regression or shrinkage. The resulting center and error term answer a different estimation question from simply placing a symmetric SEM margin around the observed score. Neither construction can be identified from the interval’s appearance alone.
Stanley and Spence’s “The Comedy of Measurement Errors: Standard Error of Measurement and Standard Error of Estimation” illustrates why the distinction matters: an interval around an individual score needs an explicit account of the estimate and the error term used. The source is a methodological argument, not a trial showing that one construction works best for every assessment. A reader should therefore look in the technical documentation for the interval’s center, error term, stated confidence level, score scale, intended population, and estimation procedure. A percentage label without those details leaves the target unclear.
These questions also keep different sources of uncertainty apart. Measurement error concerns the score under a measurement model; uncertainty in an estimated norm concerns how well the reference distribution is known; and uncertainty in a difference concerns a contrast between scores. A report can quantify one without quantifying the others. The standard error of a population mean, for example, is not automatically the uncertainty around one person’s score. Likewise, knowing a score interval’s construction does not by itself say whether two scores differ.
An abbreviated consumer graphic may omit technical detail while accurately displaying a method described in its manual. Its silence is not evidence that the publisher performed no analysis. The practical reading is to treat the interval as a statement about the documented target only: if the documentation defines an individual true-score estimate or regression prediction, interpret it on those terms and within the stated population and scale. If the target or construction cannot be located, the range’s visual precision does not resolve what uncertainty it represents.
Sources: The Comedy of Measurement Errors: Standard Error of Measurement and Standard Error of Estimation
Why do interval methods remain contested?
Credible psychometric sources can recommend different individual-score intervals because they do not always define the estimation problem in the same way. The standard error of estimation (SEE) is the residual error associated with predicting an individual’s latent or criterion value from observed information in a regression model. An SEM-based interval commonly starts from the observed score and an error estimate tied to test reliability. Comparing the methods therefore involves more than choosing between two formulas: it involves deciding what individual quantity is being estimated and which evidence the model is entitled to use.
In “The Comedy of Measurement Errors: Standard Error of Measurement and Standard Error of Estimation,” Stanley and Spence (2024) challenge routine interpretations of SEM-based score intervals. Their discussion emphasizes that an observed score is not identical to a person’s true score and that an SEM range can be misread if readers treat its center and limits as direct certainty about the individual. They use a conscientiousness example to make the distinction concrete. The paper argues that alternative estimation approaches deserve consideration; its example and reasoning do not establish a universal procedure for all instruments or a contrast interval for two personality dimensions.
Schmukle and Rohrer’s 2025 comment, “Clarifying the Choice of Confidence Intervals in Psychological Testing: A Comment on Stanley and Spence (2024),” directly disputes the original paper’s framing. They argue that the distinction cannot be reduced to whether one is estimating a single test taker or describing a group, and that population information can be relevant even when the target is an individual. In their account, regression-based SEE intervals may be preferable when the population relationship is appropriate and adequately supported. Regression can account for that information and shrink noisy extreme observations toward the population expectation; this can change both the interval’s center and its uncertainty.
The comment also makes the population assumptions consequential. A regression estimate is only as suitable as the reference relationship and population information it uses. If those do not fit the person, instrument, or intended interpretation, the apparent sophistication of the model cannot guarantee a better individual estimate. Conversely, treating SEM as automatically neutral can hide assumptions about reliability, the score population, and the meaning of a true-score estimate. The two papers thus disagree about how to frame and choose individual-score intervals, not about whether any labeled interval can be interpreted without checking its basis.
This is a live methodological disagreement, not a settled consensus that the reader can resolve by preferring the newer paper or the method with the more familiar name. Stanley and Spence question how SEM-based intervals are commonly understood; Schmukle and Rohrer challenge that account and defend regression-based estimation when population information is relevant. Each makes assumptions about the target and available data visible. For a specific assessment, the useful question is which target its manual defines, what population its procedure represents, and whether the supporting evidence fits that use. The comment’s discussion of rescaling further underscores that estimates may be expressed on a transformed scale after regression, so a reader should not assume the predicted center must equal the displayed raw score. What matters is whether the report explains the transformation and the population model well enough to interpret the resulting estimate. This is a methodological reason for reading the procedure, not a reason to prefer regression in every setting.
That dispute is upstream from a report reader’s question about two dimensions. Both papers address how to estimate or describe one individual score. Neither supplies an instrument-specific method for estimating uncertainty in A−B for a particular pair of personality scales. A manual might provide such a contrast procedure, but its support must come from evidence and calculations suited to that pair; choosing between SEM and SEE for each component does not, on its own, create that procedure. The interval-method debate clarifies why the meaning of each score range needs documentation while leaving the pairwise question open.
Sources: The Comedy of Measurement Errors: Standard Error of Measurement and Standard Error of Estimation; Clarifying the Choice of Confidence Intervals in Psychological Testing: A Comment on Stanley and Spence (2024)
Are the two scores comparable enough to contrast?
Before asking how uncertain a gap is, ask what is being subtracted. A−B is always computable when the report prints two numbers; it is interpretable only if the numbers represent quantities that can meaningfully be contrasted. Similar labels, matching graph bars, or a shared numerical range do not establish that condition. The Standards for Educational and Psychological Testing (2014) frame score meaning around the interpretation and use being made, with evidence appropriate to the intended inference and population. Applied here, that means the report must support the meaning of this particular contrast, not merely the existence of both component scores.
Start with the constructs. Do the two scales represent dimensions that the instrument defines as distinct but comparable parts of one profile, or do their names conceal different kinds of claims? A report might label one scale “planning” and another “social initiative,” for example, but those labels alone do not tell you whether a five-point difference has an intended interpretation. One scale might summarize frequency of a behavior while another captures preference, confidence, or an evaluation against a norm. Subtracting the displayed values would then mix meanings even if both are called traits. This is a question about the scale definitions in the manual, not a judgment that either scale is invalid.
Next check the score metric and direction. Two scores both displayed from zero to one hundred could be raw totals, transformed scores, percentiles, or proprietary indices; identical endpoints do not make their units interchangeable. A percentile indicates relative standing in a reference distribution, not an equal-interval quantity: the numerical distance between two percentile ranks need not represent the same amount of underlying trait difference at different points on the scale. Nor does a higher number necessarily mean “more of” the same kind of attribute on every scale. Before treating A−B as a distance, the documentation needs to say what each metric measures and whether its direction and scale permit that comparison.
The reference frame matters too. A standardized score may be centered and scaled using a particular norm group, while another score may use a different group or transformation. Two percentiles can each describe standing against separate reference distributions; their subtraction is not automatically a direct within-person difference on a common ruler. Even when the same norm sample is named, confirm that the report’s scales are meant to support profile contrasts and not simply independent descriptions. Shared respondents or a single report page do not, by themselves, supply common units.
Form and administration can also change the intended meaning. Check whether both results come from the same instrument version, scoring rules, and relevant administration conditions. A revised form may change item content or scale construction; a report that combines scores from different versions needs documentation explaining how their meanings were linked. Similarly, a manual may limit comparisons to a particular population or purpose. The Standards for Educational and Psychological Testing (2014) support matching interpretations to the evidence and intended use, but they prescribe no universal rule for subtracting personality dimensions. The consequence is narrow: if a method was documented for another version, population, or inference, its conclusion cannot simply be carried over to this pair.
A counterpoint is important: comparable scales do not have to contain identical items. A manual can deliberately report contrasts between named dimensions and provide a common interpretive framework for them. If its evidence and scoring procedure cover the exact pair and use at issue, the scales may support a bounded contrast despite different item content. The question is whether the framework makes the comparison meaningful, not whether the scales are duplicates.
So separate the arithmetic from the interpretation. You may be able to calculate that one printed number exceeds another, yet have no basis to call that amount a meaningful trait gap. First establish that the two scale meanings, metrics, directions, versions, and reference frames permit the intended contrast. Only then does it make sense to ask how precisely that contrast has been estimated.
Sources: Standards for Educational and Psychological Testing (2014)
Why can a difference score be less precise than either score?
A contrast score is a derived quantity such as A−B: it expresses the difference between two component scores. Its precision depends on the joint behavior of both scores, not just on how precisely each one is measured alone. In variance terms, Var(A−B) = Var(A) + Var(B) − 2Cov(A,B). The covariance term records whether deviations in the two components tend to move together. If they do, shared variation can cancel in the subtraction; if their errors or deviations do not move together in the same way, uncertainty can remain large or increase. Therefore, two individually precise scores do not guarantee a precise difference.
That relationship also explains why the components’ separate reliability coefficients are insufficient by themselves. Reliability describes the proportion of score variance treated as consistent under a specified model and population; a difference uses two scores and their relationship. To estimate its reliability or standard error, one needs information about the component score variances and errors and about how the components relate in the relevant population. The same pair of component reliabilities could yield different contrast precision if their covariance differs. A report that supplies reliability for A and B but no evidence or method for A−B has not yet documented how confidently the contrast can be distinguished from measurement error.
The direction of the effect is not automatic. When two components share substantial stable variation, subtraction can remove some of that common signal along with common noise, leaving a contrast with relatively little meaningful variance. In another score construction, low association between components or distinct error sources can make the difference more variable. Reliability is a ratio involving the true and observed variance of the contrast; a small true-contrast variance can produce weak reliability even when each component is dependable. Conversely, a particular contrast could be measured adequately if its construction, covariance pattern, and population support that result. The formula identifies why joint evidence is needed; it does not predict a universal outcome from the labels “reliable” or “unreliable.”
The population qualification is practical, not technical decoration. The association between two scales can vary across age groups, language versions, or other populations, and a contrast method estimated in one group may not describe another. A coefficient for the scales in a general standardization sample therefore needs to match the people and administration to which the report applies. The manual should make clear whether its reported contrast precision is an observed property of the score construction, a model-based estimate, or a result limited to a particular group; those are different grounds for extending a conclusion.
This mechanism appears in a bounded example outside personality assessment. In “On the Reliability and Standard Errors of Measurement of Contrast Measures from the D-KEFS,” the authors examined contrast measures in the Delis–Kaplan Executive Function System, a neuropsychological battery. They derived 51 contrast reliability calculations using component reliability and correlation information from the test manual’s standardization data. The calculations covered three age bands: 8–19, 20–49, and 50–89 years. None of the 51 reported contrast reliability estimates exceeded .70; the mean was .27 and the median .30. The article also reports often-large standard errors of measurement for these contrasts.
Those results illustrate the joint-error problem: a contrast built from components can be much less dependable than a reader might infer from looking at the components separately. But the D-KEFS paper concerns executive-function contrasts, not personality dimensions. Its calculations rely on that battery’s manual estimates and age-band data; they do not measure the reliability of any personality report’s profile differences, and they cannot establish that all difference scores are poor. The study demonstrates a possibility and a reason to inspect contrast-specific evidence, not a transferable coefficient or verdict.
For a personality report, the relevant documentation would need to describe the precise scales and scoring construction, the population used to estimate their relationship, and the resulting reliability or standard error of the contrast itself. If the manual reports a correlation between component scales, that can be part of the needed evidence, but correlation alone is not a contrast reliability estimate: component variances, error assumptions, and the chosen difference metric also matter. Nor can a high component reliability substitute for a reported uncertainty method tailored to the difference.
This is why a wide or narrow pair of individual score intervals cannot be mechanically converted into the precision of A−B. The contrast variance depends on covariance as well as each component’s variance, and the reliability of the contrast depends on its own true and error variance. A manual may provide an appropriate profile-comparison procedure that incorporates these features; when it does, use its defined population and scope. Without that evidence, the defensible statement is that the component scores have their documented precision, while the precision of their difference remains unestablished.
Sources: On the Reliability and Standard Errors of Measurement of Contrast Measures from the D-KEFS
Could estimated norms add a different layer of uncertainty?
Yes. A normed score can carry uncertainty from two distinct sources: how precisely the person’s performance was measured, and how precisely the reference distribution was estimated from its norming sample. The second is norm-sampling uncertainty. It concerns the location of the person in an estimated reference distribution—for example, the percentile assigned to a score—not the person’s response error itself. A report can address one source while leaving the other unquantified. The distinction is useful because a confidence interval label can conceal its target: an interval for test unreliability does not automatically include uncertainty in estimated norm parameters. In normed reporting, the reference itself is fitted or tabulated from observations, so a score’s standing can shift when that reference estimate is uncertain.
In “Improving Confidence Intervals for Normed Test Scores: Include Uncertainty Due to Sampling Variability,” Voncken, Albers, and Timmerman studied how to represent uncertainty introduced when norms are estimated from a sample. Their simulation used population models based on two non-personality measures: the SON-R 6–40 nonverbal intelligence test, normed as a function of age, and the FEEST facial-expression recognition test, modeled with age, sex, and education. For each model they examined sample sizes of 501, 1,001, and 2,001, three true percentiles (5th, 50th, and 95th), four age values spanning more central and extreme parts of the observed age ranges, and 90% and 95% intervals. The authors compared Wald, percentile, and bias-corrected percentile methods for intervals around estimated percentiles, using standard and robust estimates of parameter covariance.
The results were conditional on that design. For the SON-R model, coverage generally moved closer to its intended level as sample size increased, and the percentile method performed best in almost all conditions; the main exception was the 95% interval at N=501, where Wald performed better. For FEEST, coverage was generally closer to ideal than in SON-R, and percentile and bias-corrected methods performed about equally well. The percentile method was again broadly competitive; differences between methods were small for FEEST, while for SON the method differences were larger at the 5th and 95th percentiles than at the median. Across the two models, the authors found the percentile approach performed well, but the pattern also shows why no method ranking should be detached from the model, sample size, score location, and interval level examined.
This study demonstrates that uncertainty in a norm estimate can be modeled and that its behavior depends on design choices. It does not establish how large norm-sampling uncertainty is in any personality report. Its simulated reference distributions came from an intelligence test and an emotion-recognition test, with their own norming models and predictor structures. Personality instruments may use different constructs, populations, scoring transformations, or norming designs. Whether the same methods perform similarly for those distributions remains an open empirical question, so the simulation cannot supply a correction, interval width, or warning level for an unnamed personality assessment.
For the two-score question, keep the target distinct. Norm-sampling uncertainty concerns each score’s standing against an estimated reference distribution. Uncertainty in a within-person contrast concerns the difference between two scale scores and, as the preceding section explains, depends on the relationship between those scores. Knowing that a percentile’s norm may itself be estimated imprecisely does not calculate the uncertainty of A−B; nor does a procedure for the norm estimate replace a covariance-aware contrast method. The components could matter together in a particular instrument, but the cited simulation did not combine them into a personality-scale comparison. It estimated uncertainty around normed percentiles for individual scores, not a distribution for the difference between two personality dimensions. Extending its procedure to such a difference would require an explicit model for both scale norms and their dependence, followed by evidence that the resulting interval performs for the intended report and population.
A large, carefully designed norm sample may make the sampling component small for a particular instrument and part of its score range. The Voncken simulation does not show that every publisher’s norms are materially uncertain, and its sample-size conditions should not be turned into a universal adequacy cutoff. A reader can ask the publisher or consult the technical manual for a specific point: does the reported percentile or standardized score quantify uncertainty from estimating the norms, and, if so, by what method and for which population? An answer may clarify the score’s reference standing. It still leaves a separate question—whether the report has a supported method for comparing its two scales.

What does ‘different’ mean for the report’s purpose?
A method that distinguishes two scores supports a bounded measurement conclusion: under its stated assumptions, scales, population, and procedure, the observed contrast is unlikely to be explained by the estimated measurement uncertainty alone. That conclusion is not yet a judgment that the gap matters in practice. It also does not establish that the scores are different kinds of person, that either score predicts an outcome, or that the report answers a clinical or employment question.
The Standards for Educational and Psychological Testing (2014) make intended interpretation and use central to evaluating score meaning. They distinguish reliability and precision evidence from the validity argument for a particular interpretation or use. Applied to a profile contrast, a direct discrepancy procedure might support saying that a specified pair of scale scores differs beyond the procedure’s error estimate. That is an inferential statement about those defined scores. The procedure alone does not decide what size of difference should change a decision, whether the contrast is meaningful to the reader, or whether acting on it improves an outcome.
Practical importance needs its own bridge. A publisher or researcher would need to explain what criterion gives the discrepancy meaning: perhaps a pre-specified threshold tied to an assessment purpose, evidence that the contrast relates to an outcome relevant to that purpose, or a reasoned interpretation supported by the instrument’s validation work. A statistically distinguishable gap may be too small to affect a real decision; a potentially useful distinction may also be estimated too imprecisely to support a firm conclusion. This is why a report should not let one technical label stand in for both questions. “Beyond estimated error” describes what the measurement procedure concluded; “important” requires a defensible account of consequences or meaning. The standards do not supply one universal threshold for personality-score differences, and a reader should not create one from the visual spacing of bars or from the fact that a rule labels a result noteworthy.
The ladder of claims therefore has separate steps. First, the scales must support comparison. Next, a suitable procedure may establish that their measured contrast exceeds estimated error. Then evidence must show what that contrast means for the stated purpose. Finally, any consequential action requires support for that use and attention to its context. Evidence at one step does not automatically carry the next: precision is not practical importance, and a meaningful profile interpretation is not automatically a prediction about a future behavior or outcome. A scale contrast can describe relative elevations within the instrument’s framework without proving that either dimension is fixed, dominant, or expressed in every setting. Those are broader claims that require different evidence.
This boundary matters especially when a report is brought into work or care settings. A general personality report does not become a diagnosis because two dimensions appear separated, a hiring score because one scale is higher, or a role-fit recommendation because a profile contrast is statistically distinguishable. Predicting job performance, deciding who should be hired or promoted, or making a clinical judgment requires evidence designed for that interpretation, population, and consequence. A profile result can instead be a prompt for a narrower self-reflection or coaching question, provided it is treated as one source of information rather than a verdict about the person.
There is a real qualification: an instrument-specific discrepancy rule, supported for a named population and purpose, can make a contrast more actionable within that scope. Readers need not dismiss such a rule merely because no universal threshold applies. They should read its documentation closely enough to identify what counts as a discrepancy, what evidence supports the threshold, and what decisions the publisher says it can inform. If the rule is validated only for a defined interpretive task, carrying it into hiring, diagnosis, or prediction would exceed that evidence. The defensible meaning of “different” is thus the one the method and its validation support—and no broader.
Sources: Standards for Educational and Psychological Testing (2014)
What if the report gives no difference interval?
If a report prints two trait scores but no result for their contrast, describe only what its documentation supports. The absence of a difference interval on a summary page tells you that the page has not shown one; it does not establish that the publisher never calculated a contrast, or that no relevant procedure exists in the technical manual. A targeted check of the manual or publisher documentation may change the answer. Look for a stated method for comparing this specific pair of scales, including the version and population it covers.
First ask whether the scales are documented as comparable for the contrast you want to describe. Similar-looking bars, a shared report, or numbers placed on the same page do not establish that their units and meanings can be compared. If the documentation does not establish comparability, keep the results separate: “The report gives score A of __ and score B of __; it does not document these scales as directly comparable.” That wording preserves both reported results without implying that the numerical distance measures a meaningful difference in the person.
If the manual does establish comparable scales but gives no direct procedure for the difference, you can describe the printed point estimates’ order, while making the missing inference explicit: “On the report’s stated scale, A’s point estimate is higher than B’s. The report does not provide a method here for estimating uncertainty in that gap.” This is a statement about the displayed estimates, not a claim that the underlying tendencies reliably differ. Do not turn the gap’s size, visual prominence, or direction into a threshold the publisher has not supplied.
If the technical manual does provide a procedure for this exact contrast, follow its definition and limits. Identify what the procedure estimates, which score pair and population it applies to, and any interpretation the manual supports. A method for another pair, version, or population may not answer the present question. The Standards for Educational and Psychological Testing (2014) frame score interpretation in relation to evidence and intended use; they do not prescribe a universal rule for subtracting personality dimensions. The practical wording should therefore track the instrument’s own supported scope rather than borrow a general rule.
Make the documentation check narrow enough to be answerable. Search for terms such as profile comparison, discrepancy, pairwise difference, contrast score, or confidence interval for differences, then verify the surrounding definition rather than relying on a keyword alone. A heading may describe a comparison without specifying its uncertainty, while a formula may apply only to a named set of scales. If the manual is unclear, ask the publisher what calculation is used for these two scales and whether it supports an individual interpretation for the relevant respondent group.
These possibilities call for different descriptions: undocumented comparability means report each scale separately; documented comparability without a contrast method permits a bounded ordering of point estimates, not a conclusion about uncertainty in their gap; and an applicable manual procedure permits the conclusion that procedure defines. The manual check is useful precisely because the consumer-facing display may be incomplete. If the documentation remains silent after that check, say what the report shows and what its available documentation leaves unresolved.
Sources: Standards for Educational and Psychological Testing (2014)
How can you apply the comparison without inventing a verdict?
Use a tentative report pattern to form a question about an episode, then examine what happened in that episode. Do not treat the score contrast as proof that a trait caused the event. The report can suggest a lens for reflection; the account of the work situation still needs its own observable details and plausible alternative explanations.
Hypothetical illustration, invented for this explanation: suppose a report shows a higher point estimate on a planning dimension than on a rapid-change dimension. A project deadline shifts with little notice, and the person begins by updating the schedule before acting. Rather than conclude, “I resist change because I am a planner,” ask: “In this episode, what did I do after the deadline changed, and what helped or hindered the response?” The question connects the report’s language to behavior without treating the score ordering as a verified difference or a causal account.
A compact note can keep the reflection specific: record the task, the context, the observable action, and the outcome. For example, the note might describe which project was affected, what changed about the deadline, whether the person revised the sequence of tasks or contacted a colleague, and what happened next. Keep the report wording alongside that record, but mark the comparison as a prompt: does “planning” help describe the action, and does “rapid change” capture the demand? If not, the episode may not fit the labels, or the labels may be too broad for this situation.
Consider other explanations before treating the episode as a pattern. The schedule update might have been required by the role, requested by a manager, or necessary because another dependency changed. The person might have had incomplete information, limited authority, or competing deadlines. Those circumstances can explain the action without a stable personality tendency. A single remembered event can also be selected because it seems to match the report, so it cannot establish a recurring behavior or confirm the score contrast.
That note should separate observation from interpretation. “I changed the sequence of tasks” records an action; “I am inflexible” assigns a broad meaning the episode alone cannot establish. The report may offer terms for noticing a tendency, but the event record should remain understandable without those terms. If the person later notices a similar action in another context, compare the conditions and outcomes rather than simply counting matches. Different outcomes or different constraints may reveal that the report phrase fits some situations better than others.
A useful record can include a counterexample as readily as a confirming instance. If a deadline changed on another occasion and the person acted immediately without revising a plan, note what differed: perhaps the change was smaller, the needed information was already available, or the team had agreed on a response. The point is not to make every event fit a score label, but to learn which features of the situation matter before describing a recurring work pattern.
The useful outcome is a sharper follow-up question, not a verdict: “Across several deadline changes, when do I plan first, and what happens when the time available is short?” Further observations could help the person reflect or structure a coaching conversation, while remaining separate from formal evidence about a stable trait. This invented example demonstrates a way to reason from report language to a concrete question; it is not research, validation, or proof that the two dimensions differ.
When can a work-pattern report help with the next question?
A low-stakes reflection tool can help you make a work question more specific when your report leaves a contrast unresolved. The Personality Report Work Pattern Report is available at /assessment. Its 100 items cover ten decision-and-collaboration continuums, and its local report synthesizes dimensions, response spread, and paired interactions. Those features can give you language for examining how tendencies combine in your own work reflection; they do not calculate whether two scores in another assessment differ beyond measurement error.
Use it, if useful, to turn a broad prompt such as “Why do I keep getting stuck in this kind of work?” into something observable: what decision did I face, how did I approach it, and what happened when I collaborated or adapted? The result is a reflection prompt, not a substitute contrast test, a career recommendation, or evidence that any trait caused a particular episode. The report has no norms, cutoff, type, or selection score. It is not validated for hiring, promotion, compensation, performance management, diagnosis, or surveillance, so its dimensions should not be used to rank people or justify consequential decisions about them.
For example, if a recurring collaboration problem feels hard to name, you might use the report as a starting point for asking whether the difficulty centers on making a decision, coordinating with someone, or responding when plans shift. Treat the answer as a hypothesis to compare with specific situations you have experienced, including occasions that do not fit. You do not need this product to perform that reflection, and its paired dimensions do not establish that a pattern is stable, unusual, or shared by other people. Its value here is limited to organizing a private question about your own work habits.
Keep the two questions separate: the assessment manual governs what can be concluded about its own score contrast; a work-pattern reflection may help you decide what behavior or situation to notice next. Participation is optional, and you can also work from your own notes or discuss a concrete episode with a coach. If your immediate need is to understand score terminology, norms, uncertainty, or report sections, browse /topics for personality-report literacy. Neither route resolves a psychometric uncertainty unless the instrument’s own documentation supplies an applicable method.
What should you do next?
Open the technical documentation for the exact assessment version you took. Find how it defines each scale, whether it says those scales are comparable, and whether it gives a procedure for estimating the uncertainty of this particular contrast. Check the stated population and purpose as well: a method applies only within the scope its documentation supports. A manual may supply an applicable comparison procedure that the summary report does not display; if it does, use the manual’s bounded interpretation.
If no relevant procedure is documented, leave the contrast unresolved. Where the scale definitions support comparison, you may state which printed point estimate is higher, while making clear that this ordering alone does not establish a dependable difference. Then choose one observable work question to reflect on, without treating the score as a verdict about you. If even comparability is unclear, describe the scores separately and ask the publisher for the missing definition. Keep that question tied to an action or context you can actually observe, and let later examples complicate your first interpretation. Keep the note private and proportionate to the question at hand.
Questions readers ask
Does a statistically distinguishable score gap mean the difference is important?
Not by itself. A method may support a bounded measurement conclusion, but practical importance and any consequential use need their own evidence.
Sources and notes
- Standards for Educational and Psychological Testing (2014)
Score interpretations and uses need evidence suited to the intended inference, population, and consequences; the standards do not prescribe a universal rule for contrasting personality dimensions.
- Understanding Confidence Intervals (CIs) and Effect Size Estimation
The Association for Psychological Science explainer distinguishes a direct interval for a paired/repeated group-mean difference from comparing separate group-mean intervals; it is a conceptual analogy for the estimand distinction, not evidence for an individual's personality contrast.
- The Comedy of Measurement Errors: Standard Error of Measurement and Standard Error of Estimation
Stanley and Spence (2024) argue SEM-centered and regression/estimation-based intervals target different individual-score estimates and show conflicting interpretations in practice; the article does not provide a universal interval for a difference between personality dimensions.
- Clarifying the Choice of Confidence Intervals in Psychological Testing: A Comment on Stanley and Spence (2024)
Schmukle and Rohrer (2025) dispute a simple single-test-taker versus many-test-taker distinction, favor regression-based SEE intervals for individual-score estimation under stated population information, and discuss rescaling; this is a methodological counterargument, not a validated trait-contrast rule.
- On the Reliability and Standard Errors of Measurement of Contrast Measures from the D-KEFS
For 51 D-KEFS contrast reliability estimates derived from component reliability and correlation information in manual data across ages 8–19, 20–49, and 50–89, none exceeded .70 (mean .27; median .30), and contrast SEMs were often large; this shows a possible precision problem in that neuropsychological battery, not personality reports generally.
- Improving Confidence Intervals for Normed Test Scores: Include Uncertainty Due to Sampling Variability
Voncken, Albers, and Timmerman (2019) simulated coverage for norm estimates using SON-R 6–40 and FEEST normative-data models, varying N=501/1,001/2,001, percentile, age, and interval method; percentile methods performed best in almost all SON conditions and near-ideal for FEEST. This concerns uncertainty in estimated norms, not a within-person trait contrast.
Apply it to your work
Turn an unresolved score contrast into a work question you can examine
From this guide: If the report leaves the score gap unresolved, identify one decision, collaboration, or change episode that would make your practical question more specific.
The Work Pattern Report can help organize reflection across decision and collaboration patterns and give you prompts to compare with a recent work example. It is a low-stakes self-report with no norms, cutoff, or selection score. Use it to sharpen a question about your own work habits, not to determine whether two scores in another assessment differ, recommend a career, or judge role fit.