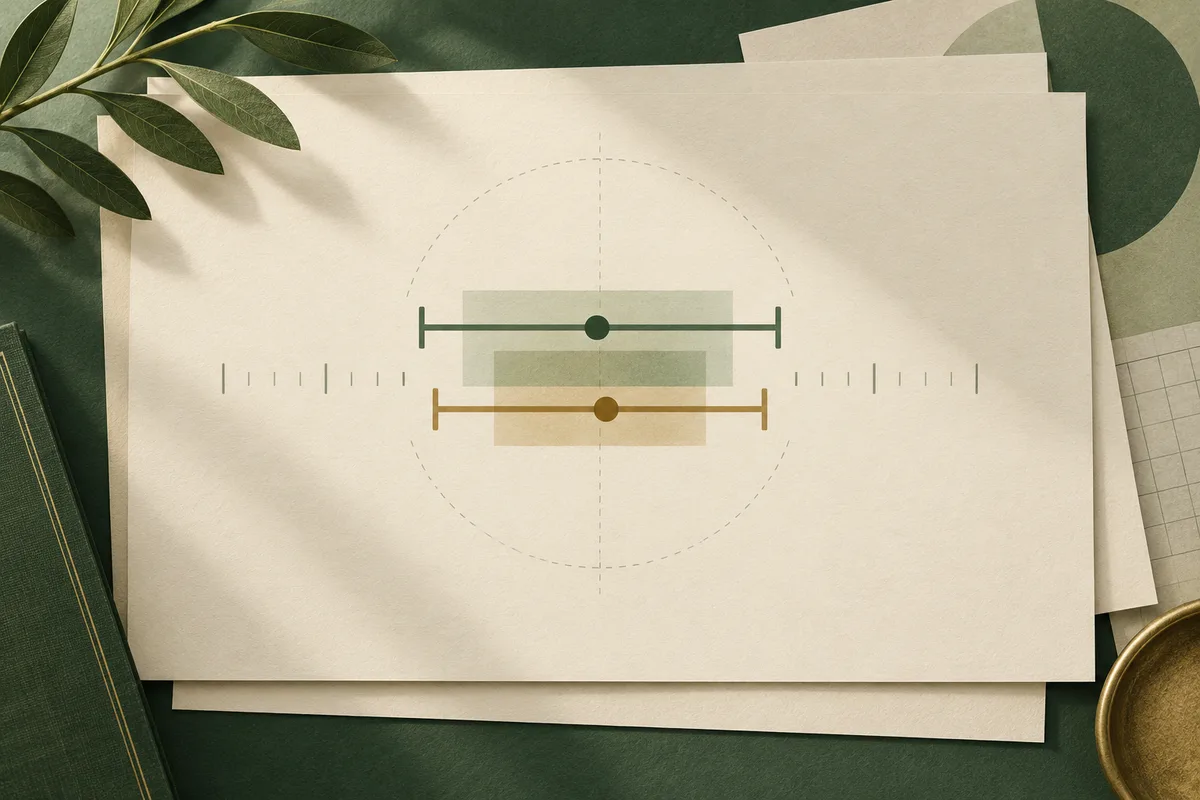
Separate confidence intervals describe uncertainty around each personality score; they do not by themselves show whether the difference between two close scores is dependable or meaningful. Look for an instrument-supported estimate of the difference and its uncertainty. If the report provides only separate intervals, leave the ordering unresolved. That does not mean the tendencies are identical.
What should you conclude when two personality scores are close?
When two personality scores are close, the larger printed number is not automatically the more dependable tendency. Separate confidence intervals describe uncertainty around each score; by themselves, they do not show whether the difference is reliable or meaningful. If the report gives no method for comparing the difference, treat the ordering as unresolved. That does not mean the tendencies are identical. It means the report has not established that one is higher beyond measurement uncertainty. A comparison asks a different question from whether either score is estimated precisely on its own. The Standards for Educational and Psychological Testing discuss precision for individual scores and, separately, considerations for comparing scores, including their relationship and the uncertainty of the difference. Applied cautiously to personality dimensions, that guidance suggests a practical check: does the report provide an instrument-supported estimate or standard error for the difference itself, and explain how it was calculated? If not, keep the point-score ordering provisional. The sections that follow distinguish each score’s interval from uncertainty in the difference, explain why comparing interval endpoints can mislead, and show how to use close results as prompts for observation rather than verdicts about work style.
Sources: Standards for Educational and Psychological Testing
What does the interval describe about each score?
A confidence interval is a range calculated by a specified method to express uncertainty around one reported score. Its meaning depends on the target score, confidence level, scale units, and assumptions used to estimate error. It is not a second score, percentile band, or label such as “average.” The joint Standards for Educational and Psychological Testing explain that a standard error of measurement can be used to construct intervals around reported scores. This is general testing guidance, not validation of a particular personality report. The standard error of measurement, or SEM, expresses estimated measurement error in the score’s units. The SEM is a precision estimate on that test’s scale, not percentile points or “points of personality.” A report may use the SEM to build an interval, but readers need the stated method and confidence level to interpret its endpoints. A number cannot be transferred from one test’s manual to another report. A frequentist confidence interval has a procedural meaning: if the same measurement process and assumptions were used repeatedly, the stated proportion of intervals produced by that method would cover the target quantity. A 95% interval therefore does not mean there is a 95% probability that this one fixed interval contains a person’s true personality. The target matters too. One method may center an interval on the observed score; another may estimate a true score through regression. The 2025 methodological article “Unbiased Confidence Intervals for Psychological Testing: The Regression-Based True Score Approach With Scale Correction” describes these as distinct approaches. It explains that regression accounts for shrinkage toward the population average but can put the interval on a different scale from the observed score; its proposed scale correction is evaluated in simulations. This proposal does not show that every personality report uses either method. Precision and validity answer different questions. Precision concerns expected measurement error under a procedure. Validity concerns whether evidence supports a particular interpretation and use. A narrow interval cannot show that a test measures the intended characteristic or supports a work-related conclusion. Nor is a confidence interval a percentile, which describes a score’s standing relative to a specified reference group. The Standards distinguish relative interpretations, which locate a score within a reference population, from other interpretations; they also note that the scale used to report a score affects how its standard error is understood. Error may vary across the score range. The Standards say conditional standard errors, estimates at particular score levels, can be more informative than one average when precision differs across the scale. Their guidance calls for estimates in the units of each reported score and, when appropriate, at several score levels. A single SEM may be adequate if the method supports treating error as constant; a report should identify that basis. Before reading a range, check the test and version, target score, confidence level, units, calculation method, and whether its precision estimate applies at that score level. These details describe one score, not whether two close scores differ reliably.
Sources: Standards for Educational and Psychological Testing; Unbiased Confidence Intervals for Psychological Testing: The Regression-Based True Score Approach With Scale Correction
What does a personality test manual show in practice?
A technical manual makes the meaning of an interval more concrete because it ties the range to a named scale, score unit, and calculation. In the Work Personality Index (WPI) Manual, the example is an Ambition score of 6 on the Sten scale, a standardized score that the manual uses for comparing results with its norm group. Table 5.5 lists a standard error of measurement (SEM) of .87 Sten points for Ambition. The text gives a 68% range of 5.09 to 6.91 and a 95% range of 4.17 to 7.83 around that example. This range concerns one score; it does not tell us whether Ambition is reliably higher than another WPI scale for the same person. The table also shows why a reader should not borrow an interval width from a different scale, much less another assessment. For the WPI, the listed SEM varies by scale: Table 5.5 reports .87 for Ambition, 1.13 for Democratic, and .60 for Social Confidence. These are all Sten-score units in this manual, but the estimated measurement precision is not identical across these scales. Nearby scores should not be read from point values alone or from an assumed shared margin of error. Use figures for the instrument, version, scale, and method at hand. The table’s heading identifies its context as N=8,360, the WPI norming sample described in the manual. The sample size identifies the context for these estimates; it does not guarantee precision for every person or show that a difference matters in practice. Norms and measurement error answer different questions. The norm group provides a reference for interpreting scores relative to a specified sample. The SEM describes estimated score precision under a measurement model. Neither, alone, validates an inference that one trait is more characteristic or consequential than another. The Work Personality Index Manual describes the ranges as where an individual’s “true score” will fall a stated percentage of the time. That describes the manual’s procedure, not a universal definition of every personality-report interval. A 2025 methodological article, “Unbiased Confidence Intervals for Psychological Testing: The Regression-Based True Score Approach With Scale Correction,” distinguishes a traditional interval centered on the observed score from a regression-based interval centered on an estimated true score. It describes different targets and assumptions and proposes a correction supported by simulations. It does not establish another report’s method or validate comparison between dimensions. So the practical lesson from the WPI example is about specificity, not authority by analogy. When reading another report, locate its own manual and check the scale, score unit, confidence level, interval method, and intended target. Confirm that any sample named is the sample relevant to those estimates. Then look separately for a documented analysis of the score difference itself. The WPI’s Ambition interval concerns Ambition alone; it cannot be carried across to manufacture a difference test.
Sources: Work Personality Index Manual, Second Edition; Unbiased Confidence Intervals for Psychological Testing: The Regression-Based True Score Approach With Scale Correction
Why is a difference its own measurement question?
The difference between two scores has its own uncertainty. To interpret it, the scores must be meaningfully comparable, and the method must account for the relation between the constructs and the uncertainty in both scores. Two confidence intervals around separate scores do not contain all the information needed to decide whether their difference is dependable. A useful way to see the distinction is to name the two quantities. A score interval describes uncertainty around one reported score under the assessment’s stated model. A difference score is the result of comparing two scores, and its precision concerns how much that comparison might vary because of measurement error. If a reader wants to say, “Dimension A is higher than Dimension B,” the relevant evidence concerns the difference itself, not just the width of each score’s separate interval. Separate endpoints cannot automatically be subtracted to produce a valid interval for the difference; that would require assumptions about scale and error. The Standards for Educational and Psychological Testing make the underlying issue explicit in guidance on comparing an individual’s scores: interpretation should consider how much the constructs overlap and the reliability or standard error of the difference score. Their commentary says that scores being compared should be placed on a common scale, and that the relationship between the measured constructs and the measurement error in each score affect the precision of the difference. Their commentary extends the concern to subscores or components from the same test. The guidance was written for educational and psychological testing decisions, so applying its logic to two personality dimensions is a measurement principle, not personality-specific validation of any particular report. “Comparable” therefore means more than having two labels printed beside each other or numbers that look alike. The scores need a defensible relationship: for example, compatible units or a documented transformation that puts them on a common scale, with constructs that the assessment has reason to compare. Similar-looking scales can still represent different quantities, so a one-point gap may not mean the same thing on each. Likewise, if two dimensions substantially overlap in what they measure, their difference may be less stable or interpretable than a reader expects from seeing two distinct names. Labels alone also cannot show that comparison is impossible; the instrument’s evidence must establish what is supported. This gives the reader a practical test of the report’s claim. Does it provide only two score ranges, or does it explain how the difference was evaluated? Look for a direct difference estimate, its standard error or interval, the scale basis, and enough explanation to understand how related dimensions and each score’s uncertainty enter the calculation. If those details are absent, the responsible conclusion is narrow: the displayed point scores are ordered, but the report has not established a dependable difference. That leaves room for both tendencies to be useful prompts for reflection without turning their small numerical gap into a firm ranking.
Sources: Standards for Educational and Psychological Testing
Why can dependence change the comparison?
When two measurements are related, the uncertainty in their difference depends partly on that relationship. A report that shows a confidence interval around each score has described each score separately. It has not necessarily calculated how uncertain the gap between them is. If the provider treats measurements as unrelated when they are connected, the comparison can misstate how precisely the gap is known. The useful question is not whether the intervals can be combined by eye, but whether the assessment documents a method for comparing these scores. The technical word for a relationship in which values vary together is covariance. Imagine that two measurements tend to shift in the same direction when a shared influence affects them. If that shared movement is present, some uncertainty may cancel when one measurement is subtracted from the other. If the sources of error move in opposite directions, uncertainty in the difference may instead grow. These explain why dependence matters; they are not claims about the size or direction of error in a particular personality report. Without the instrument’s scoring model and supporting evidence, a reader cannot tell which pattern applies or calculate it from the printed intervals. The Standards for Educational and Psychological Testing discuss comparison decisions in terms of the reliability or standard error of the difference, the relation between constructs, and whether scores are comparable. The guidance is written for educational testing, so applying its measurement principles to personality dimensions is an interpretation, not personality-specific validation. It makes a key point: uncertainty in a comparison is its own question. Two scales may appear together in one report yet represent different constructs, use different units, or have different precision. A direct difference analysis needs to address what the scales mean as well as how their errors relate. Varieties of Confidence Intervals provides an analogy from repeated-measures research. In that setting, the same participants contribute measurements under multiple conditions, so those measurements are related. The article explains that an interval for the within-person difference uses that paired structure and can differ from what one would infer from each condition’s mean interval separately. Its examples concern group means in experimental designs, not two personality scores for one respondent. They show why dependence can change a comparison; their formulas should not be transferred to a person’s trait profile. This is why subtracting interval endpoints, or comparing two ranges as if they were independent, does not establish the uncertainty of the difference. Nor does a visible gap between ranges show that the difference matters in daily life. Ask whether the report gives a direct estimate or standard error for the difference, identifies how the scales are related, and explains the intended interpretation. If it does not, keep the ordering tentative and ask the provider what comparison its evidence supports. The missing comparison is not proof that scores are equal; it means the report has not shown that their ordering is dependable.
Sources: Standards for Educational and Psychological Testing; Varieties of Confidence Intervals
What can interval overlap tell you, and what can it not?
The visible overlap between two confidence intervals is not a verdict about whether the underlying scores are equal. Nor does a gap between the bars, by itself, establish that two personality dimensions differ. The shortcut people often learn from charts comes from a narrower comparison: estimates of two independent group means. A personality report usually presents two scale scores for one respondent, which is a different inferential target. The same visual pattern therefore cannot be read as though the report had tested the difference. In “Inference by eye: Reading the overlap of independent confidence intervals,” the author explains what the chart rule can say in its proper setting. For independent means, two 95% confidence intervals that do not overlap correspond to a two-tailed test with a p-value below .05. The result is more nuanced than the common slogan that overlap means no difference: the paper reports that the intervals may overlap by roughly half the length of one interval arm while the comparison can still reach p = .05. If the intervals just touch, the reported p-value is about .01. These are not universal cutoffs for every pair of ranges. The paper investigated the approximation’s accuracy for sample sizes of at least 10 and for intervals whose widths differed by no more than a factor of two. Its title itself specifies independent intervals, and its abstract ties the finding to independent means. Those conditions matter. A personality profile’s scales belong to one person, may measure related tendencies, and may have different units or precision. That is not the independent-sample-means setup. In “Standards for Educational and Psychological Testing,” the joint testing standards discuss comparison of individual scores and identify score comparability, construct relationships, and the reliability or standard error of the difference as relevant considerations. The standards address educational and psychological testing broadly; applying their principles to personality dimensions is a measurement inference, not personality-specific validation. Still, they show why two separate intervals cannot simply be combined visually to answer a new question about their difference. The practical question is not whether the bars touch. It is whether the assessment provides a defensible estimate of the difference itself, with uncertainty calculated for that comparison and with scales that can meaningfully be compared. If it does, interpret that analysis according to the instrument’s stated method and intended use. If it does not, the point scores may still have a numerical order, but the report has not established that the ordering is dependable. Overlap does not prove equality; non-overlap does not establish a meaningful behavioral separation. Even a supported measurement difference would answer only a statistical question under its model. Whether the distinction matters in a particular conversation, planning task, or work situation requires a separate, context-bound judgment. A reader can use overlap as a cue to inspect the report’s comparison method, then reserve claims about practical importance for evidence tied to an actual context.
Sources: Inference by eye: Reading the overlap of independent confidence intervals; Standards for Educational and Psychological Testing
Does a supported score difference mean the traits matter differently?
Not necessarily. A supported difference answers a measurement question: under the assessment’s stated method, is the gap between these two scores larger than the uncertainty expected for that comparison? Practical importance asks something else: does the distinction help explain an observable pattern, clarify a choice, or change what someone should try in a particular setting? The first answer can be yes while the second remains uncertain. A score difference is not automatically a meaningful difference in daily life. The distinction matters because a report summarizes responses using defined scales. Even when its comparison method supports saying that one score is higher, the conclusion concerns those measured scores and the method’s assumptions. It does not, by itself, show that the tendencies are sharply separate in every situation, that the ordering will remain the same on another occasion, or that the gap predicts an outcome. Those are additional claims needing evidence suited to each one. The Standards for Educational and Psychological Testing treats the reliability and precision of a difference as relevant to comparison decisions. That supports asking what the estimate warrants; it does not establish a universal threshold for practical importance in personality reports. Consider an illustration, not a test result: a report’s supported comparison places a person somewhat higher on preference for structured planning than on comfort with ambiguity. The person recalls a project that began with a checklist and later changed direction. The score ordering might suggest a question to explore: did the changing requirements make planning harder, or did the person adapt once responsibilities became clear? It gives the reader something observable to compare with the interpretation: what changed, how they responded, and whether it happened again. This check can reveal other explanations. A difficult week, unclear ownership, limited time, unfamiliar work, or changing instructions may shape what happened. Those conditions limit how much one score gap can explain about one event. One counterexample does not erase a supported difference either. A tendency is a pattern to examine across relevant situations, not a rule that must appear every time. The useful question is whether the distinction adds a specific observation beyond what context already explains. For self-reflection or coaching, translate the comparison into a small question about behavior: when plans change, what information helps you decide what to do next? Then look for examples across more than one setting before treating the interpretation as a stable description. If no observable difference follows from the score ordering, the distinction may have little practical value for this decision, even if the scoring method supports a numerical difference. If examples do emerge, they can help guide a conversation or experiment, but they still do not establish job performance, suitability, or a hiring recommendation. A supported score difference earns attention; its everyday importance must be judged against the context and the consequence at hand.
Sources: Standards for Educational and Psychological Testing
What details in the report make a close comparison interpretable?
A close comparison is interpretable only when the report shows what was measured and how the difference was evaluated. Start with the instrument name and version, then check that both scores use the same scale and a sufficiently comparable measurement basis. Two scores printed side by side can look commensurable while representing different constructs or score units. The Standards for Educational and Psychological Testing discusses comparison decisions in terms of common scaling, construct relationships, and the precision of the difference. Applying that general guidance to personality dimensions is a measurement principle, not a claim that the Standards validated this particular profile. Next, identify what each displayed interval refers to. The report should state the confidence level and enough about its method to tell whether the range is built around an observed score, an estimated score, or another stated target. Check which population or score region informs its precision estimate, if that information applies to the method. These details matter because interval widths belong to a particular instrument, scale, and calculation. The Work Personality Index manual, for example, gives an Ambition Sten score illustration with its own standard error and 68% and 95% ranges. That example shows what a manual can document; its figures cannot be transferred to another test or used to infer the precision of a different pair of scores. Then look for a direct analysis of the difference: the estimated gap between the scores and an associated standard error or interval, together with a description of how the calculation handles the relationship between the scales. Separate intervals show uncertainty around each score. They do not provide, by themselves, all the information needed to judge uncertainty around the difference. A report need not use one universal formula, but it should make its comparison method and intended interpretation clear enough to evaluate. If it provides only two separate ranges, the numerical ordering has not been established as dependable by those ranges alone. Finally, ask what decision the comparison is meant to inform and whether the report identifies a practical threshold or consequence. A difference can be estimated with precision without showing that it changes an interpretation in daily life. If any link is missing, ask the provider in plain terms: “Are these scores on comparable scales? How was uncertainty in their difference calculated? Which population or precision estimate applies? What conclusion is this comparison designed to support?” The answers may clarify what can responsibly be said, or reveal that the report does not support a ranked comparison. Either outcome is useful. Until the method is documented, describe the scores as close and leave their ordering open; do not treat missing technical detail as proof that the assessment has no value.
Sources: Standards for Educational and Psychological Testing; Work Personality Index Manual, Second Edition
How should you use close scores if the report does not compare them?
When a report gives two close scores but no direct comparison, keep the ordering unresolved. A higher printed number tells you which estimate is larger on the displayed scale; it does not show that the difference is dependable. Nor does unresolved mean the tendencies are identical. In self-reflection or coaching, treat both descriptions as questions to examine in context, not as a verdict about who you are. Check whether the report identifies the instrument and version, explains what each scale measures, and says whether the scores are comparable. Then look for an estimate of the difference with its uncertainty or a method for interpreting it. Two separate ranges describe two scores individually; they do not automatically answer the question about the gap. The Standards for Educational and Psychological Testing says comparisons should attend to scale comparability, construct relationships, and the reliability or standard error of the difference. This is general testing guidance, not validation of a particular personality report. If the report provides no such analysis, ask the publisher: “Are these scales designed to be compared directly, and do you provide an uncertainty estimate for their difference?” If a ranking is unsupported, keep the scores as separate descriptions. Do not convert a small numerical gap into a strong verbal contrast, such as calling one tendency dominant and the other absent. Do not subtract interval endpoints or choose the narrower-looking range; neither operation supplies evidence about the difference. You can still use the report without settling the numerical question. Choose one recent, observable situation in which the first description seems relevant, then a separate situation for the second. Note what happened, what you did, and what the setting demanded. As an illustration, someone comparing planning and flexibility might consider a fixed deadline in one project and an unexpected change in another. Compare conditions before concluding that one tendency is stronger. A pattern that appears in one setting may not appear in another, and a single example cannot settle the score comparison. Keep the purpose proportionate. In coaching or private reflection, an unresolved ordering can guide a conversation about when each pattern appears and what the person wants to try. It should not become a hiring, promotion, compensation, performance-management, or diagnostic conclusion. For a low-stakes work-pattern prompt, the live Work Pattern Report at /assessment offers a self-report across ten decision-and-collaboration continuums. Its local report has no norm, cutoff, type, or selection score. “How Personality Assessment Reports Should Explain Limitations” emphasizes that precision information should help readers understand close comparisons, while the Standards explain why the difference needs appropriate evidence. If that evidence is absent, mark the ordering unresolved, gather context-bound examples, and ask the provider how the scales can responsibly be compared.
Sources: How Personality Assessment Reports Should Explain Limitations; Standards for Educational and Psychological Testing
What should you do next?
Check whether the scores use comparable scales and are intended for comparison. Then look for a direct estimate of their difference and an uncertainty range or standard error. The *Standards for Educational and Psychological Testing* treats score comparison as a separate measurement question involving scale comparability, construct overlap, and error. If the report shows only separate intervals, it has not established that the higher point score is reliably higher. Leave the ordering open; that does not mean the tendencies are identical. For a low-stakes conversation, note one situation in which each description seemed to fit, what was observable, and what conditions may have shaped the response. Ask the provider how the comparison was calculated if the method is unstated. The Work Pattern Report offers reflection prompts about decisions and collaboration, but it is not a job recommendation or validated employment score. A documented difference analysis on comparable scales could support a firmer comparison. Without it, use observations for reflection, not hiring, promotion, or diagnosis decisions.
Sources: Standards for Educational and Psychological Testing
Questions readers ask
If two confidence intervals overlap, does that mean the personality scores are the same?
No. Overlap does not establish equality. Separate intervals describe uncertainty around separate scores; an instrument-supported analysis of the difference is needed to assess whether their ordering is dependable.
Can I subtract the endpoints of two score intervals to get an interval for their difference?
Not without a method that accounts for comparable scales, the scores’ relationship, and their measurement error. Separate interval endpoints alone do not provide a valid uncertainty estimate for the difference.
What should I do if my report does not compare two close scores?
Treat the ordering as unresolved, check whether the scales are meant to be compared, and ask the provider how uncertainty in their difference was assessed. For reflection, consider observable examples from relevant situations.
Sources and notes
- Standards for Educational and Psychological Testing
Explains score intervals and conditional measurement error, and discusses scale comparability, construct relationships, and error when comparing individual scores.
- Unbiased Confidence Intervals for Psychological Testing: The Regression-Based True Score Approach With Scale Correction
Contrasts traditional and regression-based individual-score intervals, their targets and assumptions, and reports simulation results for a proposed scale correction.
- Work Personality Index Manual, Second Edition
Provides an instrument-specific Ambition score example with its SEM and 68% and 95% intervals, illustrating that interval values belong to a named scale and method.
- Inference by eye: Reading the overlap of independent confidence intervals
Examines the overlap shortcut for independent sample means under stated interval and sample-size conditions, not paired personality dimensions within one person.
- Varieties of Confidence Intervals
Explains how confidence intervals for within-subject differences account for paired measurements and can differ from separate mean intervals; its examples are group-means methods.
- How Personality Assessment Reports Should Explain Limitations
Existing publication guidance calls for explaining precision and how uncertainty affects close score comparisons.
Apply it to your work
Turn close scores into specific work-pattern questions
From this guide: If the report does not settle the ordering, compare what each description helps you notice in real situations.
A close score comparison may leave a practical question open: how do your decision, planning, collaboration, or change patterns show up in actual work? The Work Pattern Report offers a low-stakes self-report across ten decision-and-collaboration continuums, with a local report that describes those patterns. Use it as a prompt for reflection, not as a normed score, job recommendation, or employment decision.