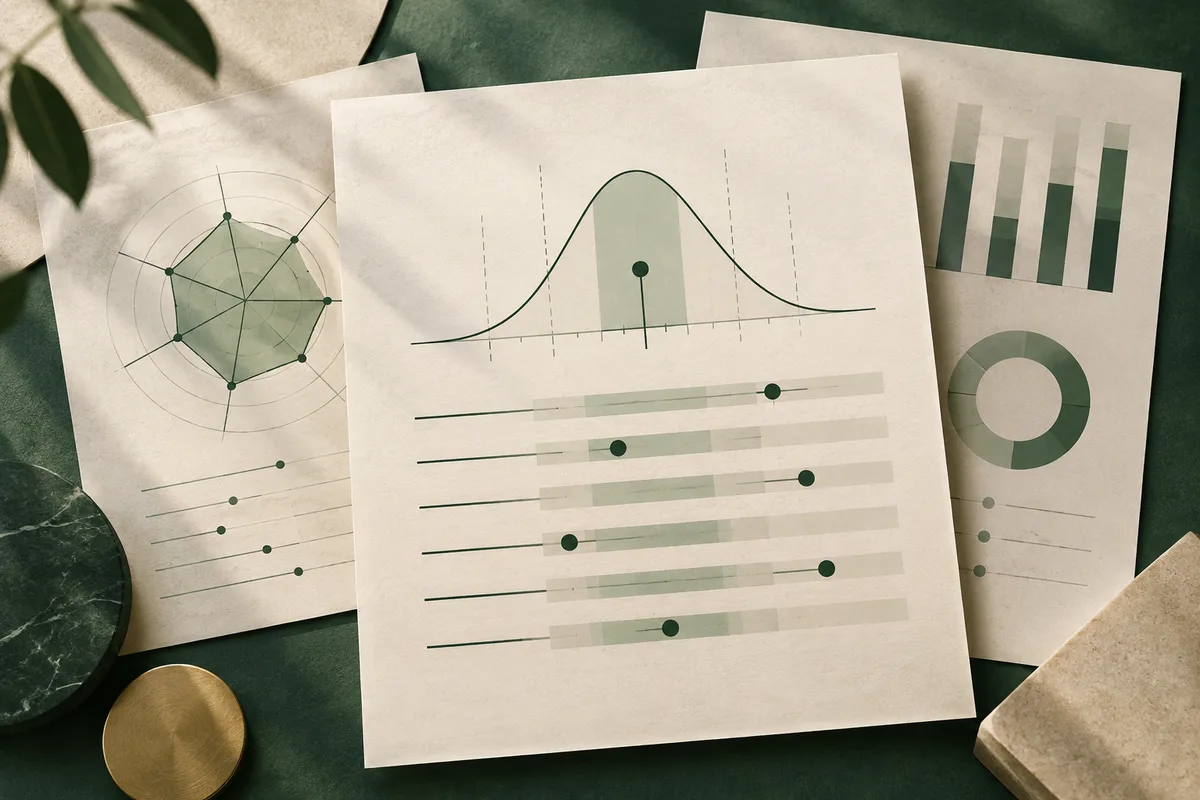
An average Hogan Personality Inventory (HPI) primary-scale percentile describes a broad score’s position relative to its norm group; it does not mean every related tendency is average. Its Homogeneous Item Composites (HICs), or subscales, may add useful detail, but Hogan’s guide says they should be highlighted only when they add interpretive value. An HIC is a prompt, not a second verdict, and should not overturn the broad-scale reading on its own.
What does an average percentile leave unresolved?
A percentile is a relative rank within a comparison group. It is not the percentage of answers that were correct, nor a direct measure of how strongly a person behaves in a particular way. So an average percentile on an HPI primary scale says the broad score sits around the middle of its reference distribution, according to the report’s scoring and labels. It does not show that every narrower theme under that scale also sits in the middle.
Hogan’s HPI subscale guide describes seven primary scales and narrower HICs. For example, Adjustment includes themes such as worry, regret, irritability, and patience. Hogan says HIC results can add detail when Adjustment is low or average. That is the publisher’s interpretive guidance: it makes a narrower theme worth examining, but does not prove that it is the cause of the broad result or that it will appear in every setting. The guide establishes intended interpretation, not the reliability or precision of an individual HIC score.
The useful comparison is therefore not ‘average or unusual?’ alone. It is the broad scale by itself versus the same scale read alongside its HIC pattern. A distinct subscale can suggest a follow-up question, but the evidence cited here does not show that it provides a more accurate personal account. If no concrete experience supports the interpretation, the evidence does not establish whether the broad score or the HIC is the better summary; keep both tentative and seek additional context rather than choosing between them.
Sources: Interpreting HPI Subscales
How do narrower item themes sit under a broad scale?
Hogan calls the subscales Homogeneous Item Composites, or HICs: clusters of related questionnaire items assigned to a primary scale. The publisher’s research department says the HICs reflect recurring themes, and that some relate to more than one broad scale. Their placement follows item development, refinement, and factor analyses. This means a HIC is a narrower lens within the report’s structure, rather than a free-standing diagnosis or a separate personality verdict.
An independent 2013 study offers limited support for viewing the instrument in layers. Salgado, Moscoso, and Alonso used exploratory factor analyses on HIC results from 200 Spanish applicants seeking several jobs at one international company. They proposed a three-level structure of broad factors, subdimensions, and HICs. This supports a layered account of score structure in that applicant sample. It does not validate individual HIC interpretations, establish their reliability or person-level precision, or show that a specific reader will behave according to a subscale label.
There is also a practical version issue. Hogan’s current product page describes 42 HPI subscales, while a 2015 Hogan FAQ describes 41 HICs. The older 2013 guide lists 42. These materials do not by themselves tell a reader which format or labels appear in a particular report. Check its edition and documentation before transferring an interpretation from another report.
Sources: FAQ Blog Series: The Hogan Personality Inventory (HPI); Subdimensional Structure of the Hogan Personality Inventory; Interpreting HPI Subscales
What does the subscale display actually compare?
First identify what the HIC value represents. Some HPI materials show raw counts, such as the number of keyed responses in a small set of items. Hogan’s later Subscale Interpretive Guide describes a bar format in which bars correspond approximately to norm-based quartiles. A raw count and a quartile are different kinds of information; neither should be treated as the primary-scale percentile unless the report explicitly says so.
The guide says raw counts are mapped nonlinearly in some HICs because response distributions can be skewed. Its example explains that several raw values on No Guilt may fall into the same low quartile. Thus, a one-point change in raw count does not necessarily represent the same shift across subscales. The guide also distinguishes an invalid or unscored subscale, which means there was not enough information to score it, from a conclusion that the respondent was dishonest.
This makes the paired reading a useful way to ask a narrower question: compare the primary percentile alone with that percentile plus its associated HIC display, while holding the report version and norming basis constant. The extra detail may help identify a theme to investigate, but the available sources do not establish that the HIC makes an individual interpretation more accurate. More detail also creates opportunities to cherry-pick a striking label or give a small difference too much weight. Raw counts cannot be compared directly with percentiles, and a quartile band is still a broad rank rather than a behavioral measurement.
Sources: Interpreting HPI Subscales; Subscale Interpretive Guide HPI
How should I use a noticeable HIC pattern?
Use a distinct HIC as a prompt to investigate one theme, while remembering that its person-level precision is not established by the sources discussed here. The Subscale Interpretive Guide cautions that a sample profile’s overall interpretation should not change dramatically based solely on subscales; it says to highlight a subscale only when it adds interpretive value. An HIC therefore should not overturn the broad-scale reading on its own. Keep the broad result in view, name the subscale theme in plain language, and ask for a recent example from a specific task or interaction. Then look for a counterexample: a time the same tendency did not appear, or a situation that changed how you responded. This is a practical reflection method, not a claim that behavior has been independently verified by the score.
For instance, if a report raises a question about worry beneath an average Adjustment percentile, the useful next step is to recall a concrete moment involving a setback: what did you do, what did the situation require, and did that response recur? The label alone cannot answer those questions. A coach or feedback provider may help examine examples, but an HIC should not be used as a diagnosis, hiring score, or job recommendation.
A useful consequence of a mismatch is to make the next conversation more precise. Instead of asking whether the report is right, describe the task, the pressure or support around it, and the behavior you actually observed. That gives a coach something concrete to explore—such as whether the pattern appears only under time pressure—without forcing a single label to explain every situation.
Sources: Interpreting HPI Subscales; Subscale Interpretive Guide HPI; Subdimensional Structure of the Hogan Personality Inventory
Questions readers ask
Does an average HPI percentile mean all subscales are average?
No. The percentile summarizes a broad primary scale relative to its norm group, while a HIC represents a narrower item theme. Hogan’s guide says the overall interpretation should not change dramatically based solely on subscales and recommends highlighting them only when they add interpretive value. Treat a distinct HIC as a question, not a replacement for the broad reading.
Can I compare an HPI raw subscale count with its primary-scale percentile?
No. A raw count records keyed responses in a set of items; a percentile locates a broad score relative to a comparison group. Some report formats convert subscale counts to quartile bands, so check the report’s scoring notes.
What should I do with a noticeable HPI subscale pattern?
Check whether the display is a raw count or norm-based band, then consider whether the theme adds interpretive value. Hogan’s guide cautions against changing the overall interpretation dramatically based solely on subscales. If useful, examine a concrete example and a counterexample; do not let an HIC overturn the broad reading on its own.
Sources and notes
- Interpreting HPI Subscales
Hogan describes primary-scale percentiles and HIC themes, including the publisher’s guidance that HICs can add detail beneath low or average Adjustment scores.
- FAQ Blog Series: The Hogan Personality Inventory (HPI)
Hogan explains HIC item themes, summative scoring, iterative refinement, factor analysis, and overlap between HICs and broad scales.
- Subdimensional Structure of the Hogan Personality Inventory
The publisher abstract reports an exploratory three-level structure from a sample of 200 Spanish job applicants, limiting the inference to that sample and method.
- Subscale Interpretive Guide HPI
Hogan explains quartile bar displays, nonlinear mappings for skewed raw counts, and differences between older and newer subscale formats.
- Hogan Personality Inventory
Hogan’s product page describes the present HPI as having seven primary scales and 42 subscales, useful for illustrating version-count variation.
Apply it to your work
Turn a broad work-style result into a question you can observe
From this guide: An HPI subscale may suggest a theme when it adds interpretive value, while your own examples help assess its relevance to a work decision.
If an HIC offers a potentially useful theme but not a clear account of how it shapes a current career decision, keep the broad-scale reading in view: Hogan’s guide cautions against changing the overall interpretation dramatically based solely on subscales. Compare the theme with specific situations—how you weigh evidence, plan, handle ambiguity, collaborate, and adapt—without letting the HIC overturn the broad result on its own. The Work Pattern Report offers a low-stakes self-reflection across those work patterns. It does not provide norms or choose a job; use it to generate more precise questions for your own review.